Memory deduplication curves: Firecracker, Docker and pVisor
Note: local
.data/paths refer to local measurement archives that are not published with the repository or the site; they are kept for batch provenance only.
Linux: preflight of deduplication speed, compression and shared libraries
Observed benefits and costs
With four instances each holding the same 64 MiB of random data, the physical pool starts sustained reclamation of 128 MiB of billed memory at about 1.7 seconds, while KSM needs about 27.8 seconds; when no shareable application pages exist, the pool occupies 391.62 MiB and spends 8.1 CPU seconds scanning for no benefit. File-read hints advance reclamation in the library experiment, while DAX directly reuses pages of an explicitly attached immutable file. All readings are single observations with N=1 per cell: no confidence intervals, stable ranking or production-density claim. The comparisons below record reclamation speed, CPU and end-of-window usage together to examine each path's benefits and costs.
The two complete preflights dated 2026-10-18 contain 21 static-memory conditions and seven library conditions, with N=1 per condition. All 1,218 / 406 content, private-write and independent-exit checks passed, along with resource, provenance and raw-evidence audits. The analysis uses only these two complete preflights; additional partial repeated measurements are excluded from aggregates. These readings provide no confidence intervals, stable ranking or production-density claim.
Why test three content types
Repetitive, compressible data can benefit from compression and sharing. Identical random data across instances compresses poorly but can share physical pages. Instance-unique random data exposes baseline runtime costs and unproductive scanning. Together they distinguish the source of savings and the cost when application pages cannot be shared.
Brief Agent tool calls make early reclamation worth evaluating separately: disposable environments or frequently released or overwritten pages may not survive a long scanning window. Library pages in persistent VMs can span multiple calls, so call duration and shareable page lifetime require separate measurement. The curves below inform these deployment mechanisms without measuring real-Agent call duration or throughput.
Common workloads and observation window
Linux x86_64/KVM, Ryzen 7 9700X, kernel 7.2.10-200.fc44.x86_64. Each group has four instances with the same 64 MiB payload. VMs use 256 MiB RAM / 1 vCPU; each Docker container has a 256 MiB limit and one CPU quota. The complete product group includes VMs and the pool, or dedicated dockerd, containerd, shims and attach clients. Every group uses four CPU quota units, CPUs 0–3, a 2 GiB ceiling and zero swap. External observers remain outside the group; global ksmd CPU is reported separately, and host KSM parameters stay unchanged.
The static experiment uses one common static worker. The separate library experiment uses identical Python userspace and actually calls dlopen on the same .so with 64 MiB of controlled data. Inputs are prepared without global cache eviction. Stock Firecracker uses virtio-blk; ordinary pVisor rootfs uses virtio-fs; Docker shares the host kernel. These product differences remain part of the comparison, so results cannot all be attributed to the VMM itself.
The 60-second window starts after every instance is ready, with group-charged memory sampled every 50 ms and process PSS every 500 ms. Scanning may already occur during sequential startup. Subsequent complete reads, private writes and exit checks remain validity gates. See the memory modes. This measures pVisor's UKSM-inspired implementation, not the upstream UKSM kernel patch.
Static working sets: idle usage and reclamation speed
The table reports complete four-instance group-charged memory at 60 seconds, in MiB, with one observation per cell. PSS and charged memory have separate plots: shared cache can be charged outside the group, while PSS omits some kernel costs. Neither directly measures incremental whole-host physical usage.
| Mode | Repeated contents | Identical random contents across instances | Instance-unique random contents |
|---|---|---|---|
| firecracker | 365.61 | 365.67 | 365.44 |
| docker-rootless | 423.99 | 423.99 | 424.10 |
| pvisor-off | 398.92 | 398.91 | 399.32 |
| pvisor-ksm | 114.22 | 177.33 | 368.89 |
| pvisor-physical | 149.14 | 222.61 | 391.62 |
| pvisor-compressed | 186.17 | 377.89 | 377.68 |
| pvisor-local | 117.46 | 373.48 | 373.75 |
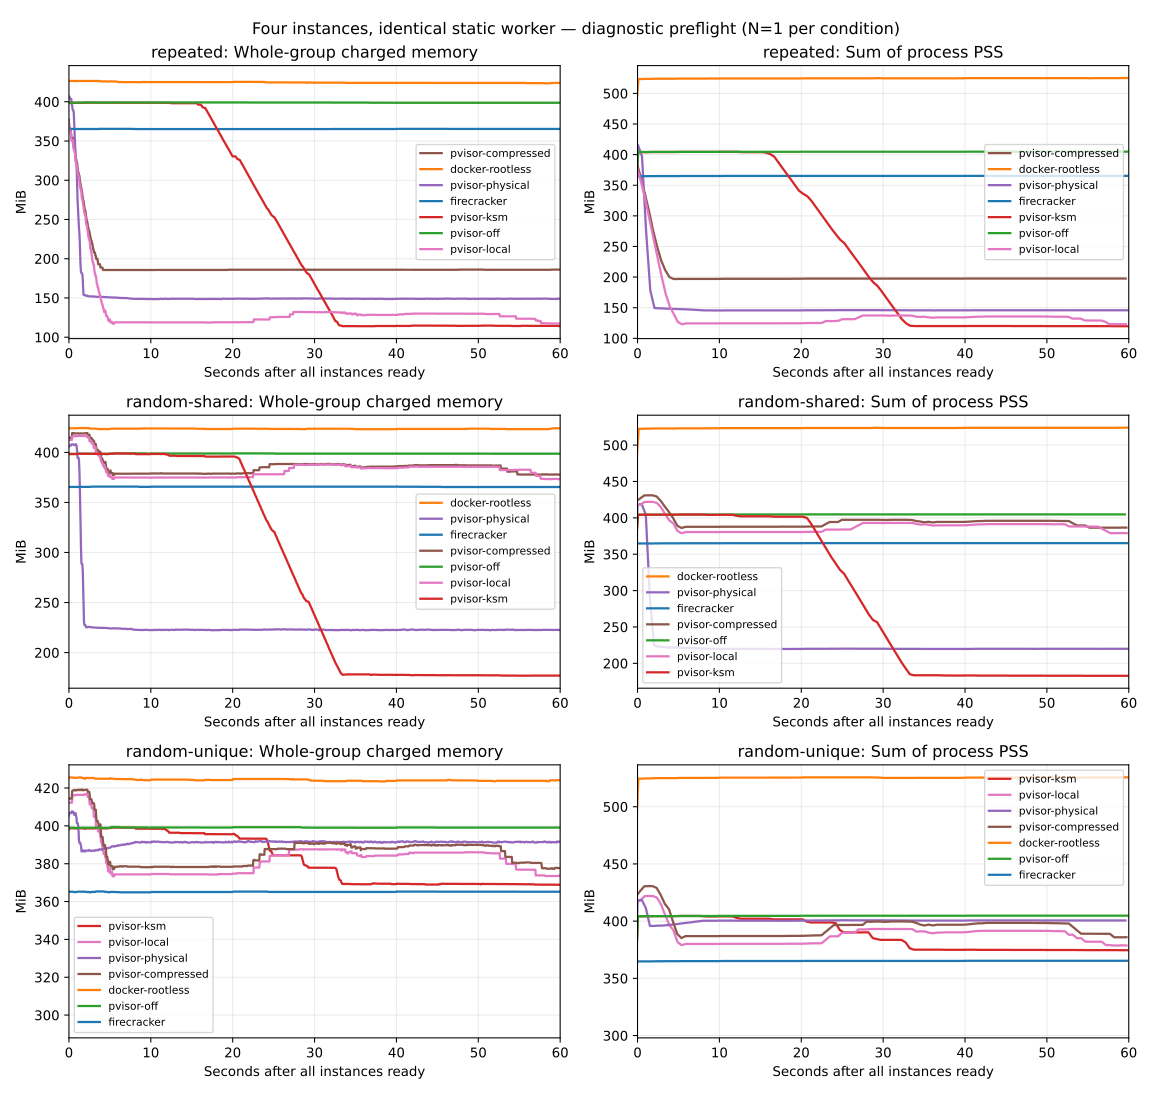
The horizontal axis is seconds after all four instances are ready; the vertical axis is whole-group MiB, with lower values indicating lower usage under that metric. The left column shows cgroup charges and the right column process PSS. Rows show repeated, shared-random and unique-random contents. Curves use raw samples without smoothing or averaging across conditions.
For shared random data, the sampled interval for a sustained 128 MiB charged-memory drop is 1.688–1.739 seconds for the physical pool and 27.723–27.773 seconds for KSM. Each uses its own all-ready footprint as reference and retains the drop through the observation window; this is not an exact convergence time. The respective 60-second group CPU costs are 5.924 / 0.384 seconds. KSM also has 0.41 seconds of global ksmd work outside the group quota, which cannot be attributed entirely to this group.
For unique random data, Firecracker uses 365.44 MiB and pVisor off uses 399.32 MiB. The difference includes guest, device and runtime costs; this experiment cannot isolate the VMM's fixed cost. The physical pool uses 391.62 MiB and 8.122 CPU seconds, with little benefit when application data lacks duplicates. Docker includes a dedicated daemon, so these costs do not describe a deployment that shares and amortizes its runtime.
Readback: retained sharing and private restoration
Complete readback of repeated contents produces the following readings. Memory is in MiB; time includes all four instances, full-byte and digest checks, and control transport, rather than pure decompression time.
| Mode | Charged memory before read | Charged memory after read | First complete read ms |
|---|---|---|---|
| pvisor-off | 398.92 | 399.09 | 621.99 |
| pvisor-local | 117.46 | 374.58 | 1157.44 |
| pvisor-compressed | 186.17 | 419.73 | 1099.13 |
| pvisor-physical | 149.14 | 149.10 | 839.57 |
Physical mode performs no compression and keeps shared mappings on reads. Compressed paths restore private RAM, increasing usage; they also change block size, admission and IPC, so the full difference cannot be assigned to the codec. The compressed pool currently requires each 64 KiB block to meet a minimum compression benefit. An independent two-session random-block diagnostic confirms this limit: both submissions of the same random block are rejected for insufficient savings, with zero pool objects.
Shared libraries: file hints and DAX
This separate seven-condition library workload has N=1 per condition, in MiB. Physical hints off/on use the same binary, with the actual setting checked for each process. Explicit DAX leaves ordinary RAM deduplication disabled; sharing comes from one immutable file backing, without scanning the target file pages.
| Library path | Group charged at 2 s | Group charged at 60 s | Process PSS at 60 s |
|---|---|---|---|
| firecracker-block | 440.93 | 441.57 | 441.08 |
| docker-rootless-library | 274.27 | 273.28 | 369.90 |
| pvisor-rootfs-off | 475.22 | 475.73 | 481.25 |
| pvisor-rootfs-ksm | 475.10 | 207.12 | 212.65 |
| pvisor-rootfs-physical-no-hints | 348.43 | 259.02 | 252.46 |
| pvisor-rootfs-physical-hints | 304.89 | 256.52 | 252.94 |
| pvisor-dax | 228.93 | 229.02 | 298.10 |
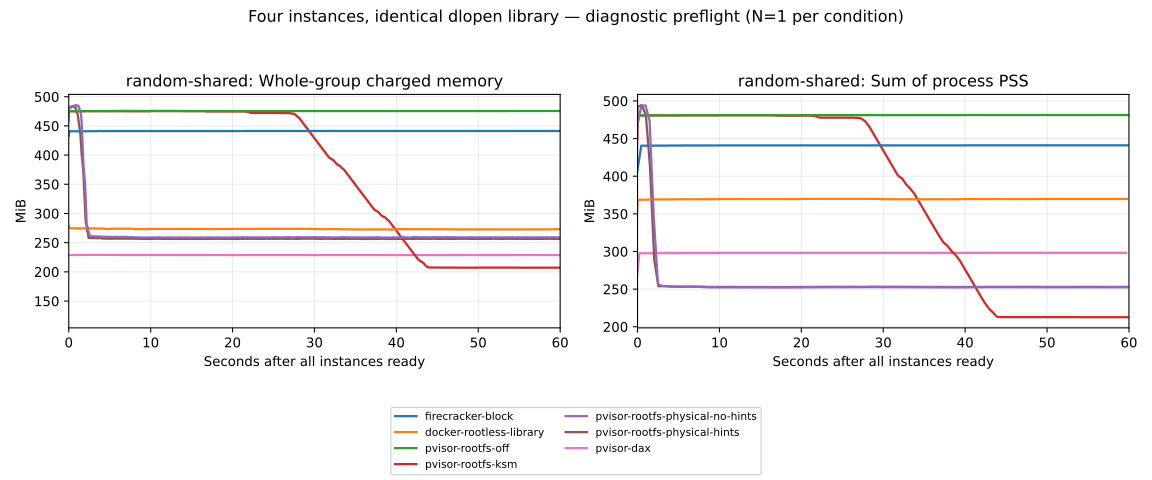
Time again starts when all instances are ready. Sharing already established during startup remains reflected in the initial footprint. The first few seconds show the effect of file hints; the 60-second readings compare usage at the end of the observation window.
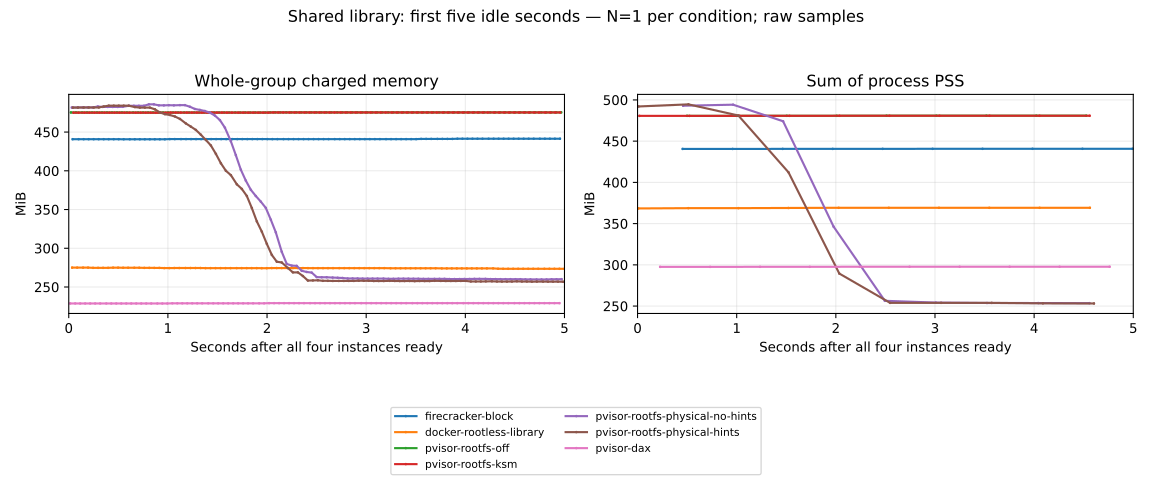
The first-five-second view retains all seven conditions and original samples to show early differences with hints off/on. PSS is sampled less often than charged memory; no exact merge time is inferred by interpolation.
With file hints enabled, group-charged memory at two seconds is 304.89 MiB, versus 348.43 MiB with hints disabled. At 60 seconds the readings are 256.52 / 259.02 MiB, with similar PSS. Cumulative group CPU is 7.552 / 7.710 seconds. These single observations do not establish a repeatable CPU improvement.
After readback, hints on, hints off and DAX each verify all 16,384 target pages (64 MiB) shared across four VMs. Evidence includes complete target bytes and before/after present-file PTEs, backing identity and offsets. Docker verifies target pages and smaps independently for its four OverlayFS views; its cross-view common-slot count remains unavailable. Target sharing and complete-group savings are separate observations: the physical pool also scans other guest memory, while DAX shares the explicitly attached file pages. The whole-group difference cannot be attributed entirely to the .so.
From observations to algorithm assessment
| Observation | Mechanism | Conclusion not established |
|---|---|---|
| The physical pool reclaims shared random contents and preserves sharing on readback | Sharing 4 KiB raw pages does not require compressibility | All savings come from application pages, or the pure scanning algorithm is faster |
| The compressed pool rejects identical poorly compressible random blocks | A compression-benefit gate on 64 KiB blocks limits admission of these duplicates | The codec's share of total CPU cost |
| File hints advance the early drop, with similar PSS at 60 seconds | Successful file reads prioritize candidates; background scanning can still discover identical pages | A repeatable improvement in final sharing or CPU cost |
| Explicit DAX already shares pages at the initial reading | Identical immutable backing and offsets allow direct file-page reuse | Automatic sharing of every library in an ordinary mutable rootfs |
For shared random contents, the physical pool reaches the sustained 128 MiB drop at about 1.7 seconds, while KSM reaches it at about 27.8 seconds and has lower memory and CPU readings at 60 seconds. Evaluating short-lived pages emphasizes early reclamation; long-lived pages also call for examining sustained cost. Both timescales require the actual page lifetime as context. These single observations do not establish pure algorithm speed, subsecond tool throughput or repeatable CPU improvements.
Full provenance and reproduction steps remain in the memory experiment record. Local raw evidence is retained in benchmark/memory/.data/q8/ and l4/, with audited report SHA-256 values 05958d9ca694f8aa63e81d2bce4a97ee7ad575d7dd19ed3279be91ceced03d8a and dfbf4fb91ea2613601bf2217dd08ddb55885591d3e1ec5c805da07b954c18f2f. Preflight and formal samples remain separate, failed conditions are not used to complete successful cohorts, and the original post-write evidence remains intact.