pVisor versus OpenSandbox: startup, disk and memory measurements
Fixed-version deployment comparison summarizes the same startup and memory cohorts without new sampling.
Historical cohorts retain their pinned sources, artifacts and timing scope. See the benchmark registry for active experiments and preparation status.
Motivation
pVisor's native guest backend reduces local sandbox wait, its compressed image pool reduces image inventory, and its smaller fixed service footprint benefits small standalone deployments. The explicit physical memory pool can further reduce identical working sets across instances. Each VM still carries kernel and runtime costs: a smaller deployment total does not mean every VM uses less memory than a container.
Steady SDK creation falls from 149.7 ms to 100.7 ms, and creation through the first checked command from 358.8 ms to 120.9 ms; the four-image inventory falls from 363.16 MiB to 121.61 MiB. In the memory experiment, service plus one sandbox is charged 92.83 MiB for default pVisor and 278.29 MiB for private OpenSandbox/Docker; four identical 64 MiB allocations charge 422.93 MiB with the explicit physical pool versus 742.94 MiB for OpenSandbox/Docker.
A separate low-memory ten-request burst comparison completes all pVisor creations in about 286 ms and all first commands in about 307 ms, reducing waits by 37% and 54%. Its complete workflow, including additional checks, instead has an approximately 17% higher memory peak. This cohort is analyzed separately from the single-request and four-instance results above.
Experiment design
Measure SDK creation and first checked command completion, allocated image-inventory blocks, and complete product-group cgroup charged memory as startup, disk and memory costs. These metrics describe the wait and resource budget of a local deployment. Lower values mean shorter waits for small tasks and fewer resources to reserve.
Single-request startup, image inventory and four-instance memory are three independent Linux x86_64/KVM cohorts; samples are not pooled and no composite score is computed. Single-request startup and four-instance memory use the same frozen pVisor performance/musl artifact and the same Ubuntu 24.04 base, targeting official OpenSandbox server/SDK/execd 1.1.0. The memory host is a Ryzen 7 9700X running 7.2.11-200.fc44.x86_64. Both request 1 CPU/512 MiB per sandbox; pVisor's limit includes supervisor/VMM while Docker's covers its container. These are not equivalent isolation or available guest-RAM budgets. A separate ten-request burst cohort uses a different artifact and 128 MiB limits, with its design and results stated in its own subsection.
Startup uses an existing rootful Docker/runc service. Images and Docker are prepared, filesystem caches remain, and image pull and API process startup are outside the clock. First-after-API-restart and steady scenarios each have 20 seeded randomized pairs of fresh sandboxes. All 80 formal creations and two steady preparation requests verify output, private files and HTTP 404 deletion; valid slow samples remain. Intervals use 10,000 paired bootstrap resamples. pVisor runs with its default memory-pool-off configuration here.
Disk inventory separately imports fixed linux/amd64 digests for Alpine, Ubuntu and two Python slim images into three fresh inventories. Docker 29/containerd overlayfs and pVisor include complete image content and metadata, subtracting Docker's empty-store fixed allocation. Allocated blocks use st_blocks × 512, count hardlinks once and disable Btrfs transparent compression in the experiment directory. Source downloads, tools, binaries and runtime writable layers are excluded: this is not the entire OpenSandbox deployment's disk footprint.
Memory uses private rootless Docker 29/containerd overlayfs with pasta/pesto forwarding. Its API, dockerd, containerd, shims, forwarding helpers and containers all reside in one product slice; pVisor includes its API, supervisors, VMMs and optional pool. Each group has a four-CPU quota, affinity 0–3, a 4 GiB ceiling and zero swap. The SDK coordinator and observer are outside. Complete preflight is retained separately; five formal rounds alternate the three configurations in a predetermined randomized order, with a fresh service and four fresh sandboxes per group.
Empty service and one idle sandbox are observed for three seconds each; four idle sandboxes are observed for five seconds. The identical static worker then retains 64 MiB of matching deterministic data per instance and blocks on control input for a 30-second observation. After full readback, every instance rewrites all data to instance-unique content, waits ten seconds and verifies every word. Private files, resource ownership, OOM/swap and native deletion are checked. Observations occur every 500 ms; each phase uses its final two seconds' median, followed by the median and range of five fresh groups. Differences use 10,000 round-paired bootstrap resamples.
Complete-group charged memory is primary, including anon/file/kernel charged to that group; configured 512 MiB and 4 GiB limits are not measured usage. Prepared image caches can be charged outside the group; Docker uses a private store copy per group, with different page-cache ownership and reuse. Group charges therefore are not whole-host incremental physical memory. Some rootless helpers deny PSS reads, so complete Docker PSS is unavailable: no comparison silently omits those processes. Background host workloads remain and are recorded; host KSM is off, and global KSM, sysctl and cache settings are unchanged.
Data and analysis
Creation and first command
Units: ms, P50; N=20 per arm/scenario, with paired 95% CIs for reductions.
| Scenario and metric | OpenSandbox Docker/runc | pVisor default | Latency reduction, 95% CI |
|---|---|---|---|
| First after API restart: SDK create completion | 388.6 | 101.1 | 74.0% [73.4%, 75.4%] |
| First after API restart: Create → first checked command | 598.1 | 121.0 | 79.8% [78.8%, 80.6%] |
| Steady fresh sandbox: SDK create completion | 149.7 | 100.7 | 32.8% [30.5%, 36.7%] |
| Steady fresh sandbox: Create → first checked command | 358.8 | 120.9 | 66.3% [65.7%, 67.3%] |
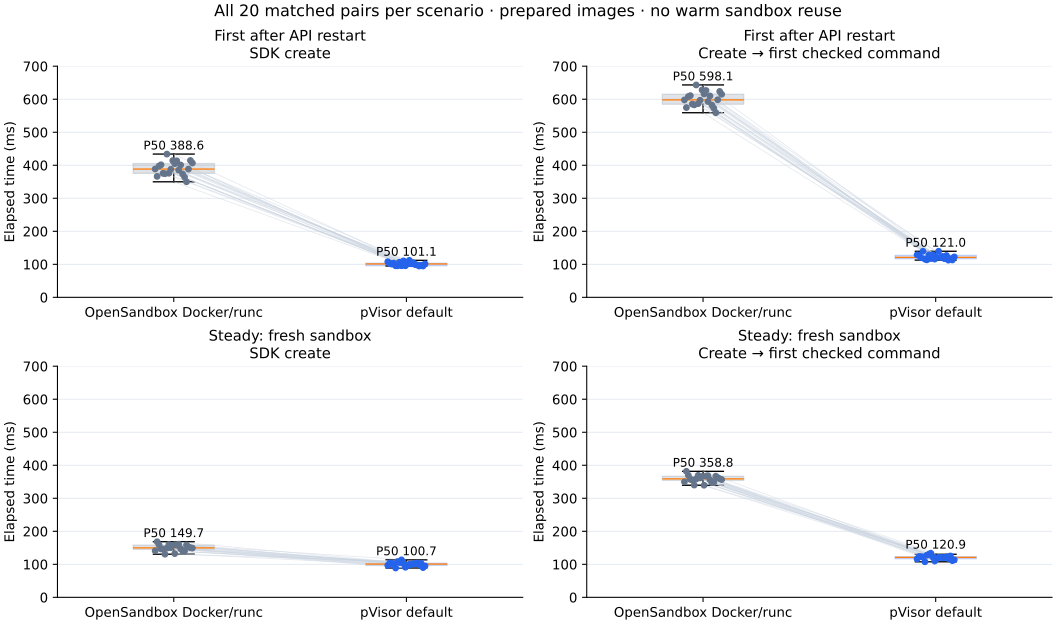
Each dot is one valid sample; thin lines join the two arms of a randomized trial. Boxes show quartiles and whiskers reach samples within 1.5 IQR; every point remains visible. All four panels share a zero-based vertical scale. Every measured pVisor creation is below its paired Docker creation, so a few slow requests do not drive the difference. Twenty pairs still cannot establish production P99.
The post-creation command path also contributes to the shorter wait. Computing “first command completion − create completion” inside each sample gives steady median additional waits of 19.7 ms for pVisor and 208.9 ms for Docker, a 90.6% reduction [90.1%, 91.0%]. These are observed per-sample intervals; subtracting two P50s would not recover them. pVisor's first and steady creation medians are close, around 101 ms, within these prepared-image and retained-cache API scenarios.
The native guest path reduces observable wait for local agents that repeatedly create sandboxes and run small commands. First request means first after API restart, not cold disk or first download. First-command differences include protocol and stream-completion behavior; they do not imply the same speedup for compilation or inference and do not cover other OpenSandbox backends.
Low-memory ten-request bursts
In the independent comparison dated 2026-10-24, pVisor reduces the wait for all ten creations by about 37% and all first commands by about 54%; all 400 formal requests succeed. Complete-workflow memory peaks are higher, so these results do not establish lower overall memory usage.
The host runs Linux x86_64/KVM, kernel 7.2.11-300.fc45.x86_64. pVisor uses a frozen performance artifact with daemon FD-table preparation, the default native guest engine and no physical memory pool. Official OpenSandbox server 1.1.0 uses private rootless Docker 29.7.2, cgroup v2/overlayfs, a private bridge and pasta/pesto, without requested network policies or an egress sidecar. Both use the unmodified official Python SDK 1.1.0 with server proxying, templates derived from the same Ubuntu digest, 1 CPU/128 MiB per instance and /bin/sleep infinity as entrypoint. Content hashes match for /bin/sh, /usr/bin/sleep and /etc/os-release; whole-template bytes and VM/container isolation contracts are not equivalent. The VM child limit includes supervisor/VMM, while the container child limit covers only the container.
Each condition has a private product group limited to 4 CPUs, memory.high=1.5 GiB, memory.max=2 GiB and swap=0. It includes the SDK, observer, API and complete VM or rootless Docker process tree; services and clients use CPU affinity 0–3. Actual child-cgroup ownership and limits are checked individually. Only one product group runs at a time, using a dedicated Docker socket and data directory. Images, services and SDK transports are prepared before timing, with host page caches retained; service startup, image import and pulls are outside the clock. Each backend passes separate 1/2/10-request preflight, followed by three warmup pairs and 20 seeded randomized formal pairs. Each condition starts fresh service processes and ten fresh instances.
One async barrier releases ten SDK creates. The two clocks end at the last create return and last first-command completion, respectively. Median actual launch spreads are 2.89 ms for pVisor and 3.53 ms for the official backend. The first command checks that its private file is absent, writes and reads an instance-unique token, and must exit zero with exactly matching output. Additional file reads, key-file hashes and resource checks run only after both primary clocks end; all instances remain alive until a common completion point before deletion. The table shows medians of 20 formal bursts per arm. Differences are pVisor − official, with 95% CIs from 10,000 paired bootstrap resamples of the 20 burst pairs; the 400 requests are not treated as independent samples.
| Metric | Unit | OpenSandbox + rootless Docker | pVisor native VM | Difference, 95% CI | Change |
|---|---|---|---|---|---|
| All ten creations complete | ms | 453.70 | 286.00 | -167.70 [-176.29, -164.62] | -36.96% |
| All ten first commands complete, from the same release | ms | 668.05 | 306.92 | -361.12 [-365.85, -355.15] | -54.06% |
| Burst-window sampled memory peak, supplementary diagnostic | MiB | 672.96 | 649.22 | -23.74 [-27.06, -19.89] | -3.53% |
| Complete-workflow kernel memory peak, including additional checks | MiB | 693.85 | 810.22 | +116.37 [+114.18, +118.70] | +16.77% |
Official creation takes 440.49–466.66 ms in 19/20 bursts (95%) and 889.34 ms in the remaining 1/20 (5%). That slow burst completes all first commands in 1098.75 ms, versus 650.74–682.29 ms for the others. It has no OOM or memory-limit violation; its cause is unattributed and the sample remains. pVisor creation ranges from 272.24–294.82 ms, and all first commands from 298.15–320.74 ms. There are no exclusions, retries or preflight samples mixed into formal results. Twenty pairs cannot establish P99 or a stable second distribution mode. Differences describe complete product paths, not the isolated benefit of FD-table preparation.
Burst-window peaks sample memory.current at a target 20 ms interval from release through all first-command completion and may miss brief spikes. Complete-workflow peaks use kernel memory.peak, including service preparation and additional hash checks after the primary clocks; pVisor is about 16.8% higher under this scope. The roughly 24 MiB window difference cannot establish a capacity advantage. Shared image and firmware caches may be charged outside the group, so group peaks are not whole-host incremental exclusive physical memory.
Including warmups, the highest complete-group peak is 812.68 MiB and minimum host available memory is 16.60 GiB. All high/max/oom/oom_kill counters and swap are zero; neither the host-below-4-GiB nor group-above-1.75-GiB stop threshold triggers. All 400 formal, 60 warmup and 26 preflight instances pass correctness and deletion checks: HTTP 404, empty inventory and absent instance cgroups. All 53 product groups, including image preparation, are reclaimed. This compares burst waits for the tested lightweight shell workload; it does not establish sustained throughput, maximum concurrency, real-agent working sets or full protocol conformance.
Local evidence remains in benchmark/startup/.data/opensandbox-pvisor-burst-ab-20261024/, outside the published site. The summary.json SHA-256 is 54dd0f400c89f504f56aef7ea910ccf325dd4db272a497992b6c37381c114ccb; the daemon hash is 3a6cc2d6932c7411128f9ce64b54673ce4650e6bef8ee2a4750eeb69dae6b944. Official source is pinned to b1a29cf93a823a95913f7943010febb3f29de05c and installed with its original server/uv.lock. Source, inputs, harness, per-burst clocks, memory traces, slow-burst logs and cleanup records remain in that directory. Archive placement and historical paths are documented in the startup experiment manual.
Image-pool disk allocation
Units: MiB, medians of three same-input inventories; reductions are relative to the tested Docker image store.
| Inventory | Docker | pVisor compressed pool | Disk reduction |
|---|---|---|---|
| alpine-3.20 | 12.53 | 4.62 | 63.1% |
| ubuntu-24.04 | 110.18 | 39.48 | 64.2% |
| python-3.12-slim-bookworm | 176.68 | 63.20 | 64.2% |
| python-3.13-slim-bookworm | 172.34 | 61.92 | 64.1% |
| combined | 363.16 | 121.61 | 66.5% |
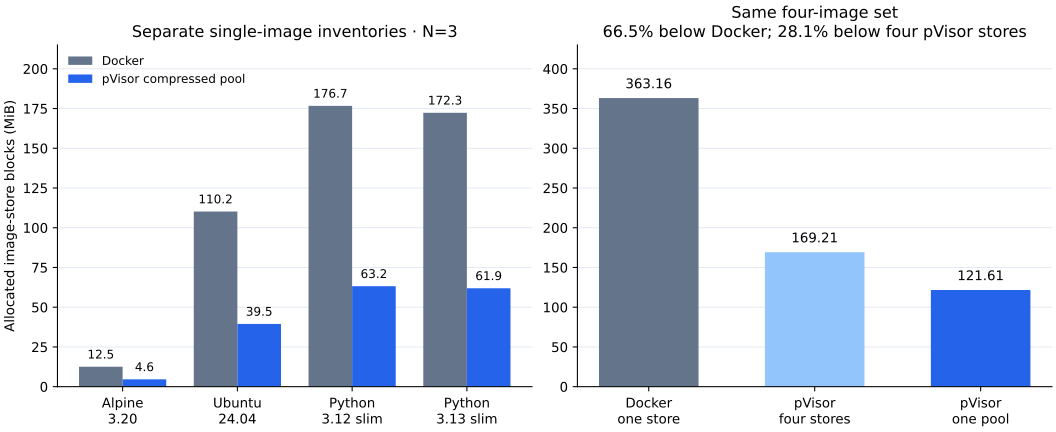
The left panel compares four separate single-image inventories; the right uses the actual four-image set. Adding the left-hand Docker bars would not give its combined allocation. The complete compressed-pool path saves space for all four inputs; sharing one pool further removes 47.60 MiB relative to four separate pVisor stores. The measured combined pool is 241.55 MiB below Docker's actual combined store. These differences describe median inventories, not a fixed saving for every additional image.
The Docker column already includes normal layer sharing. Four separate pVisor stores total 169.21 MiB, versus 121.61 MiB in one shared pool, a further 28.1% reduction. The pool retains compressed content and indexes, avoiding full rootfs expansion at creation. This inventory does not measure mmap performance, cold-read CPU, import peaks or deletion GC; it is not a universal ratio for all images or Docker storage drivers.
Service and instance memory
Complete product-group cgroup charges, MiB; each cell is the median of five fresh groups with min–max in brackets; the post-write pool condition lists four groups and one group separately. The explicit physical pool is not the default; RAM sharing and compressed image storage are different mechanisms.
| Phase | OpenSandbox + private Docker | pVisor default | pVisor explicit physical pool |
|---|---|---|---|
| Empty service, no sandboxes | 177.90 [176.04–178.50] | 4.34 [3.91–4.50] | 4.21 [3.97–4.40] |
| Service + 1 idle sandbox | 278.29 [277.11–279.32] | 92.83 [92.41–93.09] | 83.39 [82.89–83.70] |
| Service + 4 idle sandboxes | 399.65 [399.27–402.51] | 357.98 [357.61–358.36] | 278.02 [275.18–280.08] |
| 4 × identical 64 MiB, after 30 s | 742.94 [742.32–744.55] | 631.51 [631.46–632.25] | 422.93 [419.99–426.77] |
| 4 × unique 64 MiB, after 10 s | 748.71 [745.64–749.91] | 634.17 [633.76–634.80] | 4/5 groups: 631.08 [628.50–633.34]; 1/5: 646.11 |
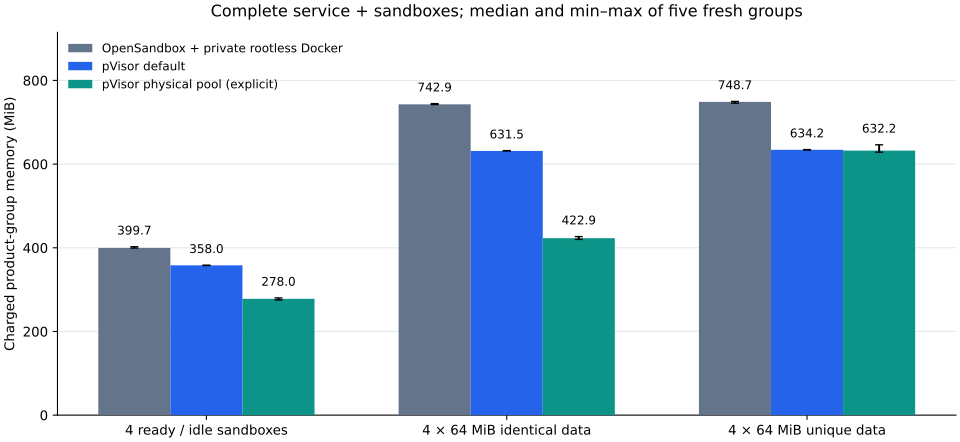
Bars are five-group medians; whiskers are min–max, not confidence intervals. Every configuration includes its background services. One post-write pool group is higher: the table uses a post-hoc 640 MiB split to describe four groups and one group. All five rounds remain in the paired statistics; this small sample cannot establish stable multimodality. Identical data is a shareable synthetic working set; unique data exposes degradation after private writes. Neither represents average real-agent savings.
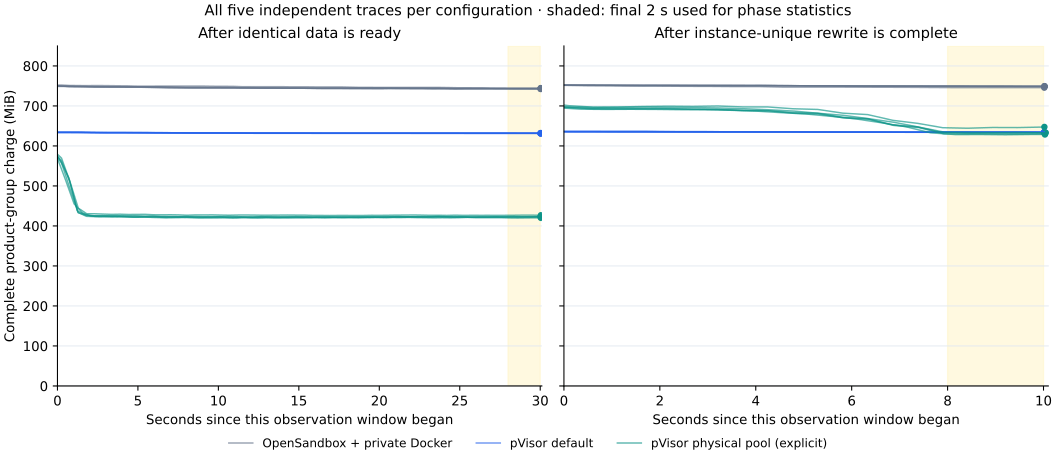
Each color retains five independent traces, directly connecting the roughly 500 ms observations without smoothing or selecting representative rounds. Pale shading marks the final two seconds used for phase statistics. The panels reset their clocks at “identical data ready” and “unique rewrite complete”; allocation, writes and intervening checks are outside them. They cannot be joined into a continuous lifecycle or used to infer write peaks. Physical-pool charges continue falling early in the shared window; unique writes increase usage, followed by release of some transient costs. These finite windows do not establish long-term convergence or stability.
Differences below subtract the right configuration from the left; negative values mean lower charges. Positive reduction percentages mean savings. Intervals describe these five rounds, not production distributions.
| Same-phase comparison | Charged difference MiB, 95% CI | Reduction, 95% CI |
|---|---|---|
| One-sandbox deployment: default − OpenSandbox | -185.46 [-186.24, -184.13] | 66.6% [66.4%, 66.8%] |
| Four idle: default − OpenSandbox | -41.67 [-44.36, -41.30] | 10.4% [10.3%, 11.0%] |
| Identical data: default − OpenSandbox | -111.43 [-113.04, -110.06] | 15.0% [14.8%, 15.2%] |
| Identical data: physical pool − OpenSandbox | -320.01 [-322.95, -317.78] | 43.1% [42.7%, 43.5%] |
| Identical data: physical pool − default | -208.58 [-211.48, -204.74] | 33.0% [32.4%, 33.5%] |
| Unique data: default − OpenSandbox | -114.54 [-116.15, -110.84] | 15.3% [14.9%, 15.5%] |
| Unique data: physical pool − OpenSandbox | -116.51 [-120.63, -103.80] | 15.6% [13.8%, 16.1%] |
The default four-idle-sandbox charged-memory interval excludes zero; the difference applies only to this private-service configuration. Default mode retains full VM lifecycle and a separate guest kernel. The physical pool reduces matching resident pages through read-only sharing and copy-on-write; usage rises when content becomes unique. Full read, write and reread checks pass: savings do not depend on discarding application data.
The following takes (phase total − same-group empty-service baseline) / sandbox count inside each fresh group, then reports the five-group median, MiB/sandbox.
| Metric | OpenSandbox + private Docker | pVisor default | pVisor explicit physical pool |
|---|---|---|---|
| Mean deployment increment per sandbox at N=1 | 100.39 | 88.49 | 79.02 |
| Mean deployment increment per sandbox at N=4 | 55.54 | 88.46 | 68.41 |
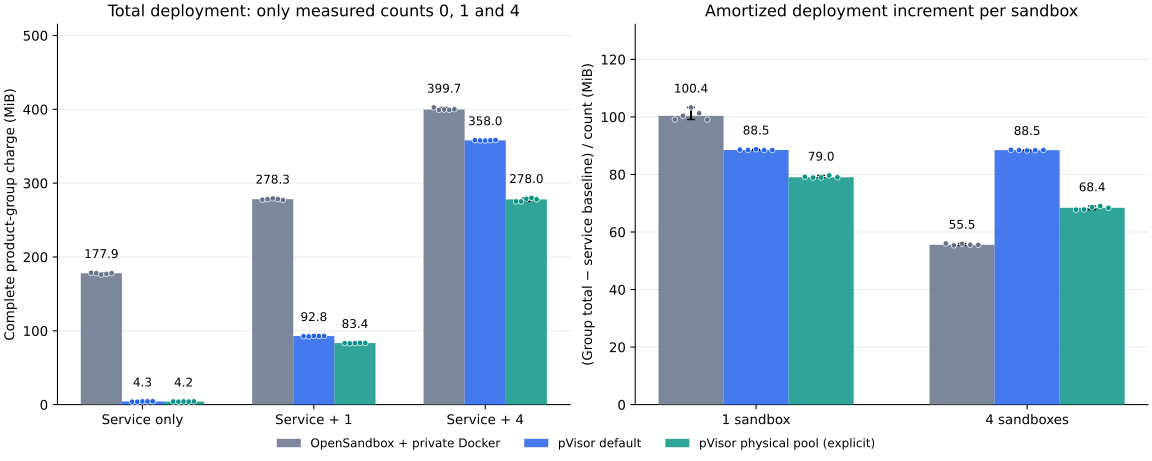
Dots retain all five groups; bars are medians and whiskers are min–max. The left panel shows only measured counts 0, 1 and 4, without a capacity curve. The right subtracts each group's own empty-service baseline before amortizing by count. Default pVisor's smaller fixed service charge gives a substantial single-sandbox total advantage. At four sandboxes, Docker's 55.54 MiB amortized increment is below the default VM's 88.46 MiB. The explicit pool lowers the VM value to 68.41 MiB; four instances cannot establish production capacity or a crossover count.
This is an amortized deployment increment, including first-use initialization and caches, not process RSS or the marginal cost of sandbox N+1. VM increments can exceed container increments; smaller background services and cross-instance sharing can still reduce the deployment total. The private Docker daemon's fixed cost is included, so these ratios do not transfer to deployments sharing an existing Docker daemon across users.
The identical-data 30-second window also records scan CPU and the wait for four complete readbacks. Values below are five-group medians and ranges; CPU is in seconds and readback in ms.
| Configuration | Group CPU seconds in 30 s | Four full readbacks, ms |
|---|---|---|
| OpenSandbox + private Docker | 0.059 [0.054–0.061] | 899.3 [897.4–901.8] |
| pVisor default | 0.162 [0.156–0.174] | 108.6 [106.1–117.7] |
| pVisor explicit physical pool | 2.861 [2.577–3.223] | 443.9 [419.4–445.8] |
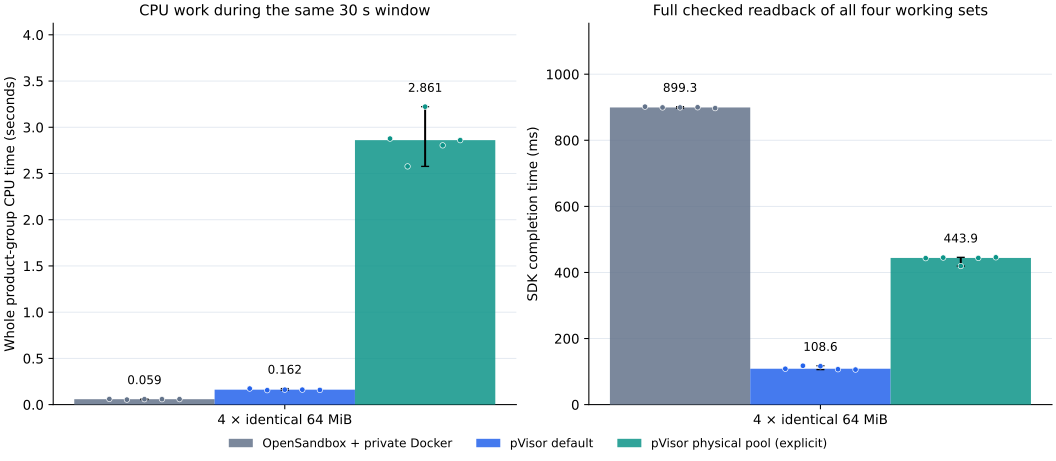
Both axes start at zero and retain all five dots and min–max ranges. The explicit pool further reduces identical-working-set memory, while whole-group CPU during the 30-second window rises from the default's 0.162 seconds to 2.861 seconds, and full readback from 108.6 ms to 443.9 ms. Deployment choices should consider shareable content, residency duration and read/write frequency. These results describe that fixed workload's tradeoff, not a prediction of net gains for real agents.
Readback includes complete content checks, SDK calls and stream completion, not pure page-fault or decompression time. The physical pool trades scanning, hashing, mapping management and COW costs for sharing. Fixed windows do not establish convergence, long-term stability or capacity. This pool does not compress unique pages; default startup and pool-enabled memory cannot be combined into one configuration's score.
Provenance and scope
The formal memory cohort contains 15 groups and 60 fresh sandboxes; all data, private-file, resource and deletion checks pass. No groups are discarded and preflight is not spliced into formal samples. Preparation and driver preflight failures remain in separate directories. Startup's long-state-path setup failure is retained separately too; all 82 creations in the valid startup cohort are deleted.
Local evidence for startup, disk and memory is respectively benchmark/.data/opensandbox-native-docker-20261024T020535Z/, benchmark/.data/image-storage-6mdz6ljh/ and benchmark/.data/opensandbox-memory-formal-20261024/. These directories are not published with the site. Their summary SHA-256 values are 8fc9fd74d6c4450dd9be07af58fbdc80156dbc6cacf4691c97daa416951b5e12, ed741f8c85bf14284e69c4f4a374baaea6a09d61461ce8ba78a0863e39be919b and 13d437b59e56bc4534d48b24999ab44c1dd5ef562ea005a4f0a66664a9ebe067 respectively.
Startup and memory use daemon SHA-256 74461c7ad588633228d44a8ada5d8335de50ea55ca9c5c543886c6533540f575; disk uses a separately frozen CLI, SHA-256 14ab9917e2d9d9c8fad513b490d43646bce1978e6f25f98ac1f641c34b55b73e. Each cohort retains source/build receipts, input digests, resource settings, every sample and logs. Reproduction is in the OpenSandbox experiment manual and image-inventory manual.
The five added figures are generated by benchmark/opensandbox/plot_comparison.py from those original cohorts, with no new sampling or source-result changes. Per-figure data, SHA-256 hashes of every input and SVG, plotting code and the Matplotlib version remain in local benchmark/.data/opensandbox-figures-20261024/, separately from the original memory-bar-chart receipt.
Results support startup and image-inventory advantages in the measured local configurations, plus memory benefits from service amortization and optional physical sharing. They do not establish complete OpenSandbox/E2B conformance, hostile-user security, production density or P99 guarantees. OpenSandbox supports other isolation runtimes, as described in its official secure-runtime guide; those paths are outside this performance comparison.