VM startup: technical analysis and experiment records
Historical cohorts retain their pinned sources, artifacts and timing scope. See the benchmark registry for active experiments and preparation status.
Note: "local original records" and paths such as
docs/src/assets/benchmarks/.data/refer to local measurement archives that are not published with the repository or the site; they are kept for batch provenance only.
Linux: startup and exit fixes retest, 2026-10-11
Exit cleanup has a measured benefit, but startup regressions are not fully resolved. Against the cf8bfa5 GNU artifact, host Ready improves by about 9.11 ms and Exit by 75.00 ms. VM Exit improves by about 48.26 ms, with no detected Ready improvement. New staged Ready has two separated clusters and cannot be declared restored.
Motivation and experiment design
This experiment checks fixes for repeated binary reads/hashes, repeated process-tree cleanup and fixed waits, together with the new filesystem execution model. The three arms are the historical cfe36981 GNU release/gateway artifact, the cf8bfa5fe8ad3438a096a2293bcc411176d388c8 GNU release/gateway artifact, and current frozen build2. All VMs use the same dynamic firmware, without mixing GNU and musl. Candidate SHA256 is 87ebb0658f2df6a84f9e4eca29c8d3d8bc01923817f04432780272c8b1b30309. Other source changes intervene between historical and current versions, so differences cannot be attributed solely to hashing or cleanup.
B-STARTUP-REVISION-ENG, Linux/KVM/FUSE: 3 warmups and 60 shuffled paired rounds per backend/version, seed 20261011. Host, staged and VM run sequentially, without overlapping filesystem sampling. The whole parent uses CPUs 0,1, a two-core quota, 16 GiB and zero swap; VMs have 2 vCPUs and 128 MiB. Each arm owns a private user/mount/PID namespace, pivot_root and warmed Host listener. Input/namespace preparation and initial service startup are outside timing. The original startup workload measures Popen to exact Ready and normal zero exit, checking output, Run Bundle, isolation and complete before/after input inventories. Formal timing uses the original Python perf_counter_ns observer without profiling, not hyperfine.
Data and analysis
All 540 formal runs and 27 warmups passed, with unchanged artifact hashes and no external build/test interference detected. Intervals use 5,000 paired-round bootstrap resamples. All slow valid samples are retained; separated clusters have no whole-distribution median ranking, and no P99 is reported. Against cf8bfa5:
- Host Ready is 29.14 → 20.03 ms: -9.11 ms, CI95 [-9.51, -8.72]. Exit is 99.16 → 24.16 ms: -75.00 ms, CI [-75.24, -74.59]. Against historical
cfe36981, Ready still adds 6.82 ms, CI [6.16, 7.27], and Exit 0.25 ms, CI [0.02, 0.63]. The major exit regression is removed, but not every metric is restored. - Staged baseline Ready is 41.23 ms. Candidate Ready has 19/41 samples in two clusters, with medians 32.17/121.95 ms; no overall improvement percentage is assigned. Exit is 118.41 → 118.67 ms, with difference interval [-31.54, 16.60] crossing zero. Historical-control Exit also has separated clusters: 53/7 samples at 34.12/74.43 ms.
- VM Ready is 119.41 → 115.25 ms: -4.16 ms, CI [-7.08, 0.77] crossing zero. Exit is 218.71 → 170.45 ms: -48.26 ms, CI [-67.43, -33.36]. Historical
cfe36981Ready/Exit in this cohort are 174.06/211.83 ms, slower than current. The versions differ in several ways, so this does not isolate a single optimization.
Overall performance acceptance still fails: staged startup is variable, and the same-artifact filesystem retest shows remaining VM write/tool regressions. These require separate diagnosis; host exit gains cannot stand in for other backends or internal task performance.
Full statistics, distributions, paired intervals, artifact and provenance records remain in the local batch or archive. Raw samples, per-trial stdout/timing, Run Bundles, inputs and build receipts are under benchmark/startup/.data/concurrency-retest2-20261011/. These engineering version comparisons do not overwrite historical cross-runtime user tables or cover cold caches, concurrent workloads, macOS or initial service startup. Polling every 0.5 s may miss brief, inaccessible or unrecognized interference.
Capability checks for current generic and trimmed kernels
The trimmed configuration passes these staged-workspace, development-tool, IPv4 HTTP and execution-snapshot restoration checks. Tests use the current CLI and two firmware variants rebuilt from identical Linux 6.12.109 sources, patches and compact packaging implementation. Complete digests verify all 79 frozen source inputs and both actual build input trees before and after; the CLI's 1,063 product source/dependency files match the current worktree. Measured on 2026-10-06, Linux/KVM, host CPUs 0,1 and 2 configured vCPUs. Tool preflights sample resources; these capability checks do not provide formal timings.
The table gives passes/attempts per configuration: 60 independent VM executions, zero failures. Shell, seven-tool and fixed-repair checks run twice per variant; every network/restore condition runs three times, with seeded randomized alternating order.
| Capability check | Generic config | Trimmed config | Actual validation |
|---|---|---|---|
| Shell readiness and normal exit | 2/2 | 2/2 | Unique ready/result markers, zero exit, VM execution record |
| Seven development tools | 2/2 | 2/2 | Tool outputs; every byte of 256 × 64 KiB writes |
| Fixed repair task | 2/2 | 2/2 | Python/Rust/Node tests; retained repaired contents |
| Small HTTP requests | 3/3 | 3/3 | 256 × 1 KiB responses and SHA256 per run; origin request count |
| Bulk HTTP | 3/3 | 3/3 | SHA256 of the complete 32 MiB response |
| Streaming HTTP | 3/3 | 3/3 | Complete ten-event contents and SHA256 |
| Denied direct connection | 3/3 | 3/3 | Direct socket denied to the same origin; no request received |
| Compressible memory / raw restore | 3/3 | 3/3 | Same token; scan/checksum of all 64 MiB after restore |
| Compressible memory / compressed restore | 3/3 | 3/3 | Same token; scan/checksum of all 64 MiB after restore |
| Random memory / raw restore | 3/3 | 3/3 | Same token; scan/checksum of all 64 MiB after restore |
| Random memory / compressed restore | 3/3 | 3/3 | Same token; scan/checksum of all 64 MiB after restore |
All twelve tool-preflight lower inventories remain unchanged. Four write checks produce 1,024 files totaling 64 MiB, with every byte independently audited. The frozen harness checks child tests, and retained repaired files are independently inspected afterward. The HTTP origin runs on the same host; allowed requests provide positive controls and deny conditions test direct sockets. No public-network or model requests are used. All 24 restored execution tokens are unique; original stdout, suspended state, restore results and OOM events are independently audited. Shared tool inputs and memory fixtures remain identical before and after.
Shell uses 128 MiB guest RAM, tools 16 GiB and networking 1 GiB, under an existing private 16 GiB parent budget. Restore uses 256 MiB guest RAM in a fresh 2 GiB, zero-swap, 200% CPU service per execution. Tool preflights sample processes; network checks verify the coordinator/parent budget, while restore checks verify service limits and sample memory. CPU placement uses affinity; complete placement over every short thread lifetime is unproven, and unknown observations remain explicit. These checks do not establish rankings or capacity under uniform strict resource enforcement.
Actual built kernel options
Both configurations enable SMP, KVM guest, CPU mitigations, seccomp/filter, namespaces, virtio-mmio, virtio-fs, virtio-net and IPv4. Trimming disables PCI, ACPI, guest security/SELinux and audit. Both still enable CONFIG_BLOCK, so device trimming cannot be described as removing all block infrastructure. Configuration differences do not establish identical hardening. Validation covers the listed HTTP and private-memory restore workloads, without a complete device, TLS/DNS/UDP/IPv6, escape-resistance or SDK-state restoration guarantee. It establishes no startup, physical-memory or density gain.
Capability and actual-configuration CSVs remain in the local batch or archive, retaining cohort timestamps, sample counts and digest associations. The two independent raw reports, individual outputs, snapshots, input manifests and build/audit receipts stay in local .data/. See the kernel configuration experiment manual. Startup and complete-task gains need separate formal paired timing with the current CLI; capability passes or file sizes cannot establish them.
1. Conclusions
A new pVisor VM returns its first command output in about 84 ms on macOS / Apple M4 and 110 ms on Linux / Ryzen 7 9700X: roughly 0.1 seconds. On the same Linux host, Firecracker starts complete Ubuntu in 5.64 seconds after provisioning or 9.25 seconds on first boot. pVisor uses directories without an OS image. Configurations differ between batches; all evidence is retained separately.
2. Motivation
Agent executors may repeatedly create isolated environments. Startup waiting affects the first command's response time and the total cost of short tasks. This work therefore measures the complete path from launching the CLI to executing a guest workload, rather than only one interval in kernel initialization logs.
Earlier investigations covered Run record persistence, runner parameter transport, early random initialization and firmware trimming. A consistent protocol is needed to establish current performance and distinguish validated gains from experiments without stable benefits. This measurement addresses three questions:
- How long does a new VM take from CLI launch to workload readiness, and how long does exit and finalization take?
- With the same CLI, how do official and trimmed firmware differ in median and tail latency?
- How much time goes into host preparation, process loading, VMM construction and guest execution, and where should optimization focus next?
Optimization must preserve isolation, durable Run records and attestation semantics. Successful execution samples must support performance claims; shorter kernel logs, smaller files or less code cannot independently replace end-to-end measurements.
3. Experimental design
Timing boundaries and workload
Measurement starts when pVisor launches and ends when a new VM executes its first shell command and returns output, labeled Ready in the tables. It covers host preparation, VM startup and command execution: the startup wait after a user issues a command.
Exit runs from the same starting point until normal runtime exit, including result persistence and shutdown. Every trial creates a fresh VM with warm host caches. pVisor uses directories; reference image download and creation occur before timing. Complete Ubuntu additionally requires distribution services to be ready, with a separate new batch.
Precise timing and control settings for reproduction
Timing uses the host monotonic clock, starting before CLI process creation. Ready ends when the host receives the guest's standalone PVISOR_BENCH_READY output. The payload only executes /bin/sh -c 'printf "PVISOR_BENCH_READY\n"', without running dmesg around the marker. Output transport and host reader scheduling are included.
Exit ends when the waiter observes CLI termination, including guest exit, sync/reboot, VMM teardown and result persistence. Separate threads wait for readiness output and process exit to avoid extra polling delays; thread scheduling still affects observations.
Environment and configuration
| Item | macOS / HVF | Linux / KVM |
|---|---|---|
| Host | Apple M4, 24 GiB RAM | Ryzen 7 9700X, approximately 30 GiB RAM |
| System / architecture | macOS 27.0.1 / ARM64 | Fedora 44 / x86_64 |
| Guest root | Prepared Alpine 3.22.1 directory | Latest --rootfs host; historical prepared Fedora directory |
| VM shapes | 1/2/4 vCPU, 128/2048 MiB; latest remeasurement uses 2 vCPU | 2 vCPU, 128/256/2048 MiB |
| Firmware | Official and trimmed libkrunfw 5.6.2 | Latest static embedded Linux 6.12.109; early libkrunfw 5.5.0 |
| Cache and preparation | Warm host caches; directories prepared before timing | Warm host caches; reference images downloaded/prepared before timing |
Hardware, guest filesystems, firmware and CLI artifacts are recorded separately. Both datasets share timing boundaries and describe startup in their respective environments; cross-platform figures do not isolate operating-system or virtualization-backend speed.
Detailed macOS artifacts and environment
| Item | Value |
|---|---|
| Date | 2026-10-03 |
| Host | Apple M4, 10 cores, 24 GiB RAM, AC power |
| OS / filesystem | macOS 27.0.1 (26A434), APFS |
| Executor | pVisor 0.3.0 release, libkrun 1.19.3, HVF / aarch64 |
| Source HEAD at measurement | d6c607e79b8c497d2994731beb2ce2b3dfe628c0; working tree status preserved in raw data |
| CLI SHA-256 | 04d4c05fbc706d34738f4a453449f9f670a7a89021f261b133aa855cb9bc19b4 |
| Guest rootfs | Alpine 3.22.1 aarch64, prepared directory, virtio-fs |
| Firmware | official libkrunfw 5.6.2 / locally trimmed 5.6.2; Linux 6.12.109 |
| Samples | 100 per main case + 5 discarded warmups; 20 per diagnostic case + 5 warmups |
| Load average, before / after | 3.23, 3.35, 4.25 / 3.31, 3.79, 4.29 |
Official firmware uses the upstream 5.6.2 prebuilt aarch64 kernel.c, wrapped into a macOS dylib without rebuilding Linux. Trimmed firmware comes from a local libkrunfw build. Both use the same kernel version, but the local source is v5.6.2-3-gf6a710f: this compares actual artifacts, not an experiment changing only one Kconfig option. The CLI's default downloader remains pinned to 5.5.0; this matrix explicitly selects 5.6.2.
The official dylib is 23.715 MiB and the trimmed dylib 11.307 MiB, about 52.3% smaller on disk. This does not imply 52.3% lower physical memory. Full hashes, parameters, source status and samples are in the Local raw record docs/src/assets/benchmarks/.data/startup-20261003.tsv. Absolute paths identify measured inputs; replace them with local paths when reproducing.
Detailed Linux artifacts, environment and validation
Linux uses the same first-command output readiness boundary and creates a new VM for every trial. The matrix tests 128, 256 and 2048 MiB with 2 vCPUs, alongside native shell and pVisor host controls.
| Item | Conditions |
|---|---|
| Date | 2026-10-03 |
| Host | AMD Ryzen 7 9700X, 8 cores / 16 threads, approximately 30 GiB RAM; btrfs |
| System / backend | Fedora 44; Linux 7.2.8-200.fc44.x86_64; KVM / x86_64 |
| Guest filesystem | Prepared host Fedora root, --rootfs /; commands execute with /bin/sh |
| Artifacts | Fixed GNU release CLI from this round's VM validation; libkrunfw 5.5.0, without a firmware-trimming comparison; full SHA-256 values in raw data |
| Samples | 5 warmups and 100 measured trials per case; five cases shuffled each round; startup diagnostics disabled |
| Host load | One-minute load average 0.67 → 1.32; ordinary background workloads retained |
The matrix contains 500 measured samples, including 300 real VM launches, plus 25 warmups. Every pVisor sample requires completed records and a zero exit code; VM samples also verify actual virtual_machine isolation. Failures stop measurement with raw logs retained and cannot count as faster samples.
Linux and macOS share the first-output timing boundary, but hardware, guest filesystems, firmware and CLI artifacts differ. These results describe startup in each environment and do not isolate operating-system or virtualization-backend speed. Linux uses a fixed artifact; subsequent source changes are outside this dataset.
Sampling, validation and statistics
Cases are warmed up and randomly ordered per round, with separate Ready/Exit distributions and successful long tails retained. macOS and the early Linux main matrices use N=100; the new deployment comparison uses N=30. Stage diagnostics are separate. Each table states N, excluding warmups.
Every pVisor sample requires completed records and a zero exit code; VM samples also verify actual virtual_machine isolation. Failures or missing readiness output never enter successful distributions. Historical main matrices stop on failure; the new deployment comparison records failures and continues other cases. Percentiles describe the batch rather than guarantee long-term tails or performance on other machines.
macOS paired statistics and control settings
The main matrix contains 1,000 successful samples, with 80 additional diagnostic samples and 70 discarded warmups: 1,150 launches total. After timing, VM trials require a completed Bundle, zero exit status and virtual_machine isolation. Failures, missing markers and incorrect isolation abort measurement rather than count as fast samples.
Case order is randomized each round. Subtract trimmed Ready from official Ready at the same shape and round, then take the median of differences. The 95% interval uses 5,000 fixed-seed bootstrap resamples. It describes this batch's variation, not systematic differences across machines or workloads.
The original full matrix disables PVISOR_STARTUP_TIMING, with diagnostics enabled in a separate batch; the later P0 remeasurement enables routine logging. Each main trial uses a new working directory, skips personal Agent defaults, disables OverlayNet and inherits stdio, without Gateway or TUI. Native shell and host execution provide context; macOS and Alpine use different shell builds, so subtracting their times does not precisely isolate virtualization overhead.
Routine startup diagnostics
Startup logs help identify which phase accounts for the wait. They are enabled by default; set PVISOR_STARTUP_TIMING=0 to disable them. This article retains both the original matrix without logs and the latest remeasurement with logs enabled. Use results from the same batch when comparing variants.
Log fields and collection
The current implementation emits pvisor-startup level=info checkpoints by default, without a debugging switch. Fields include Unix timestamp_ms, pid/ppid, JSON-quoted run_id, stage, monotonic_us and process_elapsed_us. Early process events use "-" before Run identity exists; correlate them by PID with later identified events. Parent and runner share the same Run ID. Compute intervals using the host monotonic clock, not the adjustable wall clock.
Ordinary CLI diagnostics use stderr and can be retained by production collectors. TUI diagnostics use the existing frontend log; a pre-opened dedicated descriptor sends VM runner diagnostics to the same channel without polluting the Agent terminal. Records include no commands, environment variables or credentials. Output is best-effort, adds no fsync and is not recovery metadata.
PVISOR_STARTUP_TIMING=0 explicitly suppresses checkpoints for uninstrumented benchmarks; unset and 1 both enable logging. Historical measurements in this article use archived artifacts and do not establish zero overhead from routine logging. cli.session_started and runner.vmm_built mean Session started and VMM constructed, respectively, not guest or application readiness. There is no generic guest-ready notification yet.
4. Experimental data and analysis
Measured median startup for new VMs is on the order of 0.1–0.2 seconds. macOS data includes firmware comparisons, phase diagnostics and controlled optimization remeasurements; Linux data includes three memory shapes and host controls. Each dataset's complete results and analysis follow separately.
macOS / HVF
The latest Apple M4 remeasurement has median readiness 84.35 ms and P95 112.14 ms. Controlled remeasurement records those results; the full matrix and phase accounting below come from earlier independent batches and remain separate.
Full matrix: end-to-end results without diagnostic logging
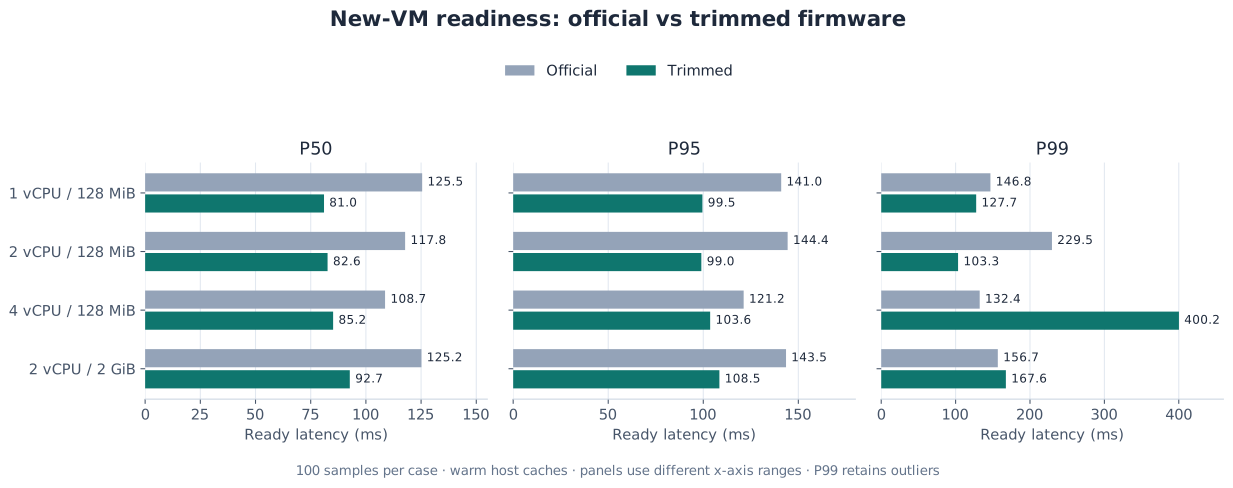
Figure 1: Readiness across VM shapes. Panels use different x-axis ranges. P99 retains tail samples; a better median does not mean every launch improves equally.
All values are milliseconds, N=100 per row. direct is native shell, host is the pVisor host executor, and VM names encode firmware, vCPU count and MiB.
| Case | Ready P50 | Ready P95 | Ready P99 | Exit P50 | Exit P95 |
|---|---|---|---|---|---|
direct |
5.16 | 7.36 | 8.15 | 5.44 | 7.66 |
host |
31.49 | 37.34 | 44.08 | 56.63 | 70.56 |
official-1cpu-128 |
125.49 | 140.99 | 146.79 | 202.61 | 302.99 |
trimmed-1cpu-128 |
81.03 | 99.55 | 127.66 | 138.58 | 200.79 |
official-2cpu-128 |
117.77 | 144.38 | 229.53 | 190.21 | 291.47 |
trimmed-2cpu-128 |
82.64 | 98.98 | 103.31 | 142.56 | 194.52 |
official-4cpu-128 |
108.68 | 121.24 | 132.39 | 188.59 | 262.58 |
trimmed-4cpu-128 |
85.15 | 103.62 | 400.23 | 153.01 | 199.25 |
official-2cpu-2048 |
125.15 | 143.53 | 156.74 | 211.97 | 314.88 |
trimmed-2cpu-2048 |
92.71 | 108.48 | 167.57 | 167.68 | 252.12 |
With 100 samples, P99 is close to the observed maximum and cannot guarantee long-term tail latency. Background load, power, APFS persistence and scheduling affect later batches. The earlier roughly 84 ms observation came from another batch; it is not a fixed performance constant.
The batch also contains substantial tails: trimmed 4 vCPU / 128 MiB has 2/100 trials above 200 ms, maximum 412.91 ms; official 2 vCPU / 128 MiB has 3/100, maximum 389.00 ms. Rounds 15 and 68 each contain multiple slow cases. Main samples lack fine-grained diagnostics, so persistence, scheduling or other host activity cannot be assigned as the cause. All successful samples remain included; outliers were not removed to improve P99.
Paired firmware improvement
| vCPU / MiB | Paired saving P50 | Bootstrap 95% CI | Trimmed faster |
|---|---|---|---|
| 1cpu-128 | 44.62 | [42.60, 47.18] | 98/100 |
| 2cpu-128 | 33.79 | [32.35, 37.14] | 99/100 |
| 4cpu-128 | 23.88 | [22.72, 25.15] | 96/100 |
| 2cpu-2048 | 34.94 | [32.21, 37.13] | 98/100 |
Median paired savings need not equal the difference between group medians. More vCPUs or RAM do not necessarily start faster. This matrix uses no snapshots, resident VM pool or memory-sharing scan.
Where startup time goes
Diagnostics identify host preparation and guest startup through output arrival as the two main costs, each around 30 ms; VMM construction takes about 3 ms. Further reductions should focus on Run records and filesystem preparation, and on the guest startup path.
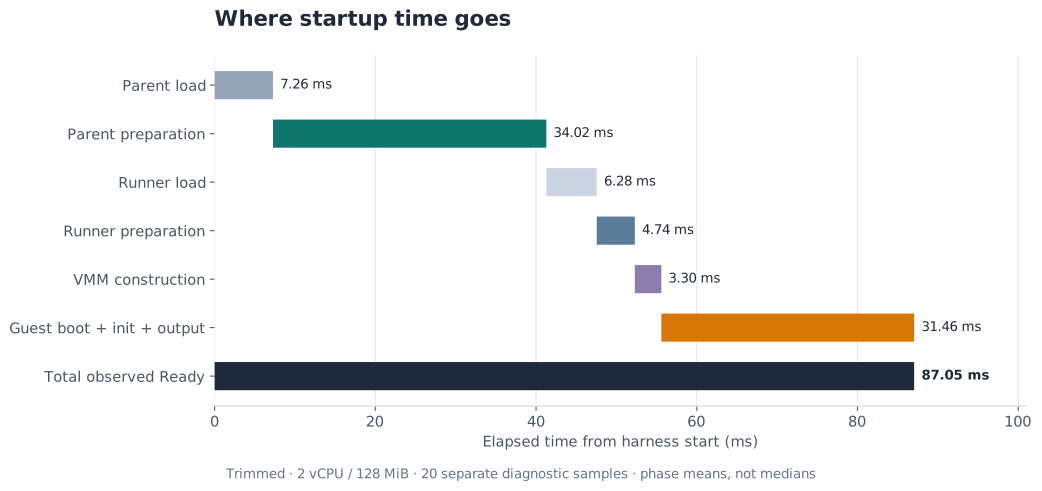
Figure 2: Phases follow startup order; horizontal position shows cumulative elapsed time. Diagnostic means sum to 87.05 ms; the table also lists P50. The guest phase includes initialization, workload execution and output arrival.
These independent diagnostics use trimmed firmware, 2 vCPU / 128 MiB and N=20. Diagnostic Ready P50 is 87.67 ms. Subtracting it from the main batch does not estimate logging overhead.
| Boundary | P50 (ms) | Mean (ms) |
|---|---|---|
parent_load |
7.14 | 7.26 |
parent_prepare |
33.73 | 34.02 |
runner_load |
6.17 | 6.28 |
runner_prepare |
4.78 | 4.74 |
vmm_build |
3.19 | 3.30 |
guest_and_output |
31.08 | 31.46 |
Phase boundaries and clock checks for verification
Boundaries are harness start → parent main → runner spawn begins → runner main → libkrun entry → VMM construction completes → marker received. Host checkpoints and harness share CLOCK_MONOTONIC. Each sample's six phases must close exactly to its Ready interval. Phase means also add; independent medians generally do not.
guest_and_output includes guest boot, PID1 initialization, shell exec, virtio console transport and host reader scheduling. Guest dmesg uses a different clock and cannot be subtracted from host timestamps. Earlier auxiliary logs for the same artifacts put official kernel-to-Run /init.krun around 42–43 ms and trimmed around 21 ms; that historical batch is excluded from this table.
Nested preparation spans follow. Storage contains record and overlay work; do not add all three.
| Nested span | P50 (ms) |
|---|---|
storage |
30.72 |
record |
18.02 |
overlay |
12.15 |
agentctl |
0.14 |
ram |
0.18 |
spec |
0.11 |
attestation |
4.12 |
Durable records and overlay preparation dominate parent preparation. Runner preparation also includes device configuration and attestation. JSON parsing or one virtio-fs log line cannot explain the whole guest interval.
Validated and retained optimizations
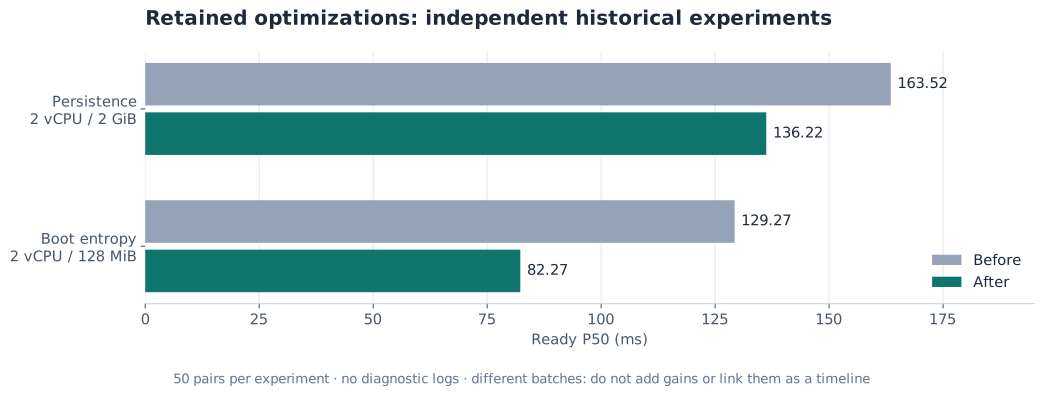
Figure 3: Independent historical comparisons validate persistence and boot entropy changes. Each uses 50 pairs, with different shapes and batches; they are not a continuous optimization timeline and gains cannot be added.
Remove duplicate persistence while preserving Run semantics
Non-Gateway startup combines initial RunRecord writes. Unchanged indexes reuse their inode and contents while retaining required file and directory synchronization; invalid indexes, permissions and moved paths are repaired. Runner specs use private temporary IPC files held by the parent, without long-lived-record fsync requirements.
An earlier 50-pair, no-log experiment at 2 vCPU / 2 GiB with identical trimmed firmware reduced Ready P50 from 163.522 to 136.217 ms. Median paired savings were 24.507 ms, with 48/50 pairs faster. Parent main-to-spawn P50 fell from 54.804 to 34.675 ms. This validates persistence changes within that batch; do not concatenate it with today's numbers as a single experimental curve.
Supply fresh boot entropy
The aarch64 FDT supplies a fresh 32-byte rng-seed for every new VM from the host OS random source. RNG failure stops boot instead of falling back to a fixed seed. Linux obtains early entropy without removing guest DRBG or entropy health checks.
An earlier 50-pair, no-log experiment at 2 vCPU / 128 MiB reduced Ready P50 from 129.270 to 82.268 ms. Paired savings were 47.614 ms, 95% CI [46.590, 48.750], with 50/50 pairs faster. The diagnostic CPU_ON interval fell from about 49.849 to 4.080 ms. That interval includes its surrounding startup path, not 50 ms of pure PSCI execution.
Trim firmware to actual VM and Agent requirements
Unused GPU/display/input hardware, rare filesystems and crypto algorithms, debugging exports and unnecessary memory/power capabilities were removed. Required virtio, virtio-fs, console, networking and crypto remain. Algorithm self-tests and Jitterentropy health checks are separate mechanisms; security checks were not indiscriminately disabled.
Today's paired data validates the combined trimmed artifact, not an exact contribution from each removed driver. Smaller kernel code can reduce mapping, initialization and cache costs, but file size alone does not determine boot time. The customized libkrunfw configuration remains the authority for enabled capabilities.
Remove experiments without stable benefits
The compressed init argv transport was removed; guest initialization still reads bounded JSON. The kernel random-capability cache patch remains experimental because additional benefits after FDT seeding were unstable. A 20-pair cleanup comparison showed no stable regression. Detailed per-exit/MMIO and virtio-fs instrumentation was removed; lightweight, default-off host checkpoints remained at that point; this mechanism now provides the routine diagnostics described above.
Controlled remeasurement of both P0 changes
The baseline is fixed commit 52e77c60d6352960a4d2ab4ef8661f3d5b1b2797. Changes are applied sequentially, excluding concurrent HVF/VMM working-tree edits. All release artifacts use one isolated source and target directory: baseline is unchanged, attestation removes temporary receipt synchronization, and both additionally deduplicates directory barriers. Firmware and prepared rootfs remain identical; routine checkpoints are enabled throughout (1 is equivalent to default behavior). Official firmware was not remeasured; its earlier numbers are not a same-round control for these results.
Round one retains complete receipt writes, normal-exit validation and failed-entry truncation, removing only two sync_data() calls. Round two creates the full directory tree before syncing the first new directory's parent and each new directory once. N new levels require N+1 directory barriers instead of 2N. Existing-directory behavior and sync-error propagation retain their contracts; RunRecord and index publication remain synchronous atomic operations.
At 2 vCPU, each artifact has 100 formal samples and 5 warmups at 128 and 2048 MiB: 600 formal samples and 30 warmups. All six cases are randomized each round. Values are milliseconds; Ready still runs from before process creation to workload stdout marker, while Exit is measured separately. See the Local raw record docs/src/assets/benchmarks/.data/startup-p0-20261003.tsv for samples and hashes.
| MiB | Variant | Ready P50 | Ready P95 | Ready P99 | Exit P50 |
|---|---|---|---|---|---|
| 128 | baseline |
90.50 | 107.99 | 717.92 | 155.10 |
| 128 | attestation |
84.69 | 101.89 | 149.32 | 144.91 |
| 128 | both |
84.35 | 112.14 | 193.52 | 144.60 |
| 2048 | baseline |
97.27 | 116.15 | 183.06 | 182.45 |
| 2048 | attestation |
94.36 | 108.69 | 503.98 | 177.42 |
| 2048 | both |
94.55 | 110.57 | 145.46 | 176.42 |
| MiB | Comparison | Paired saving P50 | Bootstrap 95% CI | Faster |
|---|---|---|---|---|
| 128 | baseline → attestation |
6.61 | [2.98, 8.80] | 70/100 |
| 128 | attestation → both |
1.30 | [-0.98, 3.35] | 53/100 |
| 128 | baseline → both |
5.64 | [4.00, 8.46] | 73/100 |
| 2048 | baseline → attestation |
3.61 | [2.01, 6.35] | 66/100 |
| 2048 | attestation → both |
2.31 | [-0.31, 4.42] | 56/100 |
| 2048 | baseline → both |
4.24 | [1.61, 5.77] | 66/100 |
| Variant (128 MiB) | Attestation P50 | Storage P50 | Parent preparation mean | Ready mean |
|---|---|---|---|---|
baseline |
4.03 | 33.33 | 48.66 | 104.74 |
attestation |
0.04 | 33.63 | 42.32 | 91.34 |
both |
0.04 | 32.57 | 37.42 | 88.73 |
Round one has positive end-to-end paired intervals at both memory sizes. Its attestation span falls from about 4.03 to 0.04 ms; all 100 pairs at 128 MiB improve that span. Round two's independent end-to-end intervals still cross zero, so an additional stable millisecond gain is not established; redundant directory calls are demonstrably reduced. The combined changes improve the median in this batch, but 128 MiB Ready P95 changes from 107.99 to 112.14 ms, so tail latency does not improve universally.
An earlier batch used 50 samples per case, with 1-minute host load average falling from 18.38 to 8.66 and all end-to-end intervals crossing zero. Its Local raw record docs/src/assets/benchmarks/.data/startup-p0-20261003-first.tsv remains archived and is not pooled with this batch. The second batch's load average is 5.67 → 6.87: lower, but not a fully isolated idle host. All successful tail samples remain included.
Savings are median same-round differences, with 5,000 bootstrap resamples. Median gains from the two rounds cannot be added. Nested-span medians do not sum to total latency either. Intervals crossing zero do not establish stable improvement; exit tails and readiness tails remain separate observations.
Checks cover four sync targets for three new directory levels, no additional barriers for existing directories, and immediate sync-error propagation. All artifacts also pass real-VM success, nonzero guest exit and deadline checks: the first two retain enforcement evidence; deadlines leave it unknown. Temporary receipts are not recovery state. These checks validate runtime semantics, not actual power-loss behavior.
Next optimization boundaries
Temporary attestation synchronization and duplicate barriers within directory creation are addressed by the P0 experiments above. Next investigate barriers across RunRecord/index publication and preparation steps, then process loading and PID1 work, preserving failure, cancellation and attestation semantics.
RunRecord is authoritative state before execution. Required persistence cannot become an unawaited background task. Merge redundant barriers and parallelize independent work where safe, then validate with paired measurements and failure/recovery checks.
Linux / KVM
Image-free pVisor and complete Ubuntu: deployment waiting
A fresh short-task VM becomes usable in about 0.11 seconds; complete Ubuntu on Firecracker takes 5.64–9.25 seconds to boot and execute a command. Ubuntu comes from the latest official cloud VM release, pinned to 26.04.1 LTS / 20260927. Its stock 7.0.0-34-generic kernel, initrd, modules and services are retained. The command runs after systemd multi-user, networking, cloud-init and the SSH socket are active. pVisor uses --rootfs host, its embedded kernel, and installed host tools without preparing an OS image.
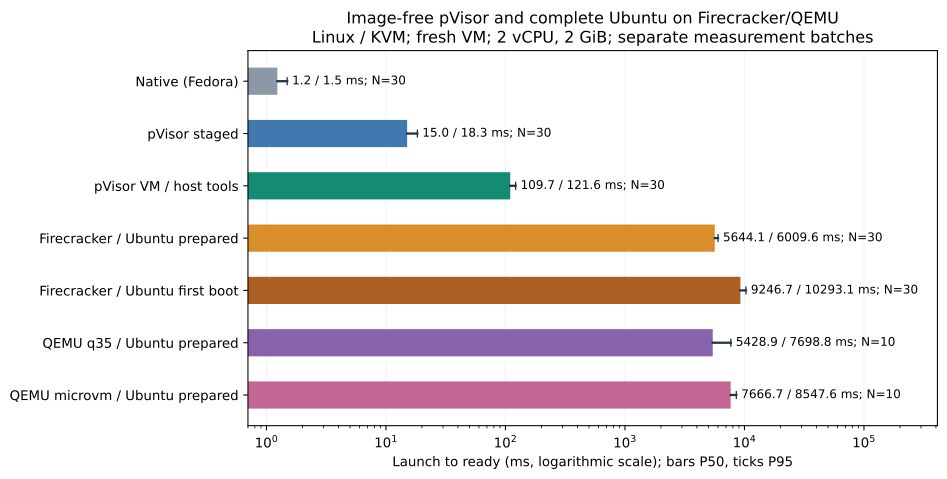
Linux / KVM, 2 vCPU / 2 GiB, the same two-core host budget, 30 samples for each of the first five rows and 10 for each QEMU follow-up row, all with 3 warmups; the batches pass 150/150 and 20/20 formal startup trials respectively. Every trial creates a fresh VM without a RAM snapshot or resident pool, with warm host disk caches. Prepared Ubuntu uses a disk template with installed tools and completed initial cloud-init. First boot uses an uninitialized complete Ubuntu template with NoCloud networking and the measurement service, without the complete Agent toolset. First boot does not include downloading the image.
| Backend | N | Ready P50 / P95 / P99 ms | Exit P50 / P95 ms |
|---|---|---|---|
| Native / Fedora | 30 | 1.23 / 1.49 / 1.73 | 1.29 / 1.57 |
| pVisor staged | 30 | 15.04 / 18.32 / 19.35 | 43.75 / 44.52 |
| pVisor VM / host | 30 | 109.69 / 121.62 / 141.53 | 173.57 / 193.94 |
| Firecracker / Ubuntu | 30 | 5644.11 / 6009.57 / 6583.04 | 9234.94 / 9626.10 |
| Firecracker / Ubuntu first boot | 30 | 9246.65 / 10293.13 / 10322.29 | 12862.17 / 13875.61 |
| QEMU q35 / Ubuntu | 10 | 5428.90 / 7698.78 / 8968.91 | 9054.86 / 12078.24 |
| QEMU microvm / Ubuntu | 10 | 7666.69 / 8547.61 / 8706.71 | 11199.06 / 12100.94 |
QEMU boots the same complete Ubuntu, rather than the historical trimmed kernel. q35 and microvm share Firecracker's stock kernel, initrd, tools and initialized disk template. A minimal device model does not remove seconds of distribution boot in this configuration. These are independent same-host cohorts; QEMU has N=10, background host load remains, and outliers are retained. Similar medians do not support a precise VMM ranking. QEMU first cloud-init boot is unmeasured.
Local raw record docs/src/assets/benchmarks/.data/full-ubuntu-qemu-20261004/samples.csv · QEMU protocol
Selection meaning: Creating environments for one or two commands benefits from avoiding seconds of OS boot. Complete Ubuntu provides distribution services and an independent Ubuntu environment at that startup cost. These are deployment paths with different kernels, initialization and storage; the table does not establish a roughly 50-times VMM advantage for libkrun. For longer jobs, compare task and internal tool time, where boot cost is amortized.
Exit includes normal shutdown: pVisor P50 is 174 ms, Firecracker/Ubuntu about 9.23 / 12.86 seconds. Firecracker/Ubuntu uses default MMIO devices and the stock initrd, with zero VMM exit after guest reboot. Every trial retains full OS proof with no failed units. Workspace copying or private disk cloning is recorded as prepare_ms, with medians around 37 / 29 ms outside Ready. The chart uses a logarithmic axis, bars P50 and ticks P95. With N=30, P99 is near the maximum and describes this batch only.
Local raw record docs/src/assets/benchmarks/.data/full-ubuntu-20261004/samples.csv · Local raw record docs/src/assets/benchmarks/.data/full-ubuntu-20261004/summary.tsv · Method and reproduction · Local raw record docs/src/assets/benchmarks/.data/full-ubuntu-20261004/ubuntu-ready-mmio-20261004/evidence.tar.gz
New VM startup results
At 2 vCPU / 128 MiB, median readiness is 172.69 ms and P95 is 180.37 ms. Median readiness is approximately 175 ms at 256 MiB and 220 ms at 2 GiB. This workload only prints one line; additional configured RAM does not reduce startup waiting.
Values below are milliseconds, with 100 measured samples per row. Ready ends at the first command output; Exit includes finalization. Host controls run in the same rounds, and all VM samples pass isolation checks.
| Case | Ready P50 | Ready P95 | Ready P99 | Exit P50 | Exit P95 |
|---|---|---|---|---|---|
| Native shell | 0.66 | 0.75 | 0.86 | 0.72 | 0.83 |
| pVisor host | 6.62 | 7.08 | 8.00 | 13.18 | 13.57 |
| KVM / 2 vCPU / 128 MiB | 172.69 | 180.37 | 182.39 | 233.97 | 254.22 |
| KVM / 2 vCPU / 256 MiB | 175.41 | 183.74 | 186.86 | 233.99 | 254.13 |
| KVM / 2 vCPU / 2048 MiB | 220.47 | 228.20 | 231.22 | 284.08 | 294.39 |
In this batch, new VMs become ready in about 0.2 seconds, with exit completion around 0.23–0.28 seconds. Evaluate those boundaries separately. These are fresh VM launches and do not establish snapshot restoration time. Linux has no detailed startup phase accounting in this batch, so macOS phase proportions cannot be applied to it.
Trimmed kernel and direct init: historical Docker / Firecracker / QEMU controls
These Firecracker/QEMU controls use a trimmed kernel and static init, skipping Ubuntu system-service boot. The 73.74 ms value belongs to that minimal path; see the complete Ubuntu deployment comparison above. pVisor in this historical batch uses a prepared tool directory shared through virtio-fs, without an OS image.
With the same two-core host execution budget and prepared environment, pVisor VM Ready P50 is 86.29 ms, close to Docker 90.12 ms and QEMU microvm 88.10 ms; Firecracker measures 73.74 ms. This locates its hundred-millisecond scale near mature microVM paths, without claiming to beat all of them.
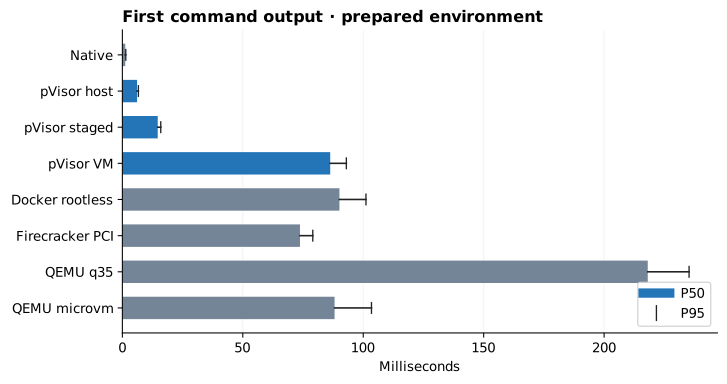
Bars show P50 and lines P95, not confidence intervals. N=30, 3 warmups, randomized backend order per round. VMs use 128 MiB/2 vCPU; every runtime is bound to physical host cores 0 and 1, including the Docker daemon and in-container tools. The environment already contains Python/Node/Rust/Git/Claude/Codex; the workspace has 2,048 files and a 64 MiB input. Preparation and cloning are measured separately.
| Backend | N | Ready P50 / P95 / P99 ms |
|---|---|---|
| Native | 30 | 1.20 / 1.42 / 1.49 |
| pVisor host | 30 | 6.10 / 6.65 / 7.01 |
| pVisor staged | 30 | 14.68 / 15.94 / 16.09 |
| pVisor VM | 30 | 86.29 / 92.99 / 94.89 |
| Docker rootless | 30 | 90.12 / 101.13 / 112.01 |
| Firecracker PCI | 30 | 73.74 / 79.06 / 81.21 |
| QEMU q35 | 30 | 218.12 / 235.27 / 237.07 |
| QEMU microvm | 30 | 88.10 / 103.42 / 109.75 |
QEMU q35's 218 ms does not establish QEMU's minimum startup cost: microvm with optional legacy devices disabled measures 88 ms. Both are retained. Firecracker and QEMU share a trimmed Linux 6.12.109 kernel and ext4; pVisor uses its own embedded firmware and staged virtio-fs. These are complete command paths, so their differences cannot all be attributed to the VMM.
First output does not establish that an Agent can complete a task. Seven-tool version checking takes 1.40 seconds in pVisor VM. See the complete tool environment for repair/test timing and CLI compatibility. The preceding 172.69 ms GNU/libkrunfw 5.5.0 batch remains historical evidence. This batch uses a new pinned static artifact; it is not a controlled single-configuration optimization experiment.
Configuration and reproduction · Local raw record docs/src/assets/benchmarks/.data/reference-env-20261004/samples.csv · Local raw record docs/src/assets/benchmarks/.data/reference-env-20261004/summary.tsv · Local raw record docs/src/assets/benchmarks/.data/reference-env-20261004/evidence.tar.gz · Local raw record docs/src/assets/benchmarks/.data/reference-env-20261004/compatibility.tsv
Full-exit follow-up: cleanup is separate from Ready
Same configuration, a separate 30 samples per backend and 3 warmups. A dedicated process waiter records exit rather than the main batch's polling; Ready percentiles remain separate. pVisor VM returns first output in about 88 ms and completes CLI exit in about 153 ms. Environment availability and completed recording/cleanup are separate budgets.
| Backend | Ready P50/P95 ms | Exit P50/P95 ms |
|---|---|---|
| Native | 1.27 / 1.99 | 1.35 / 2.05 |
| pVisor host | 5.98 / 9.91 | 13.23 / 15.78 |
| pVisor staged | 14.61 / 21.83 | 43.52 / 47.36 |
| pVisor VM | 88.46 / 142.99 | 153.11 / 207.68 |
| Docker rootless | 94.29 / 237.58 | 123.38 / 286.71 |
| Firecracker PCI | 74.18 / 92.76 | 101.82 / 121.81 |
| QEMU q35 | 219.74 / 306.82 | 248.39 / 338.34 |
| QEMU microvm | 87.42 / 170.44 | 116.09 / 199.42 |
Local raw record docs/src/assets/benchmarks/.data/reference-env-20261004/followups/reference-startup-exit-20261004/report.tsv · Local raw record docs/src/assets/benchmarks/.data/reference-env-20261004/followups/reference-startup-exit-20261004/samples.csv · Local raw record docs/src/assets/benchmarks/.data/reference-env-20261004/followups/reference-startup-exit-20261004/evidence.tar.gz
5. Reproduction and raw data
macOS / HVF
Prepare the release CLI, Alpine rootfs and both firmware directories, then run:
python3 benchmark/pvisor/vm_ready.py \
  --binary target/release/pvisor \
  --rootfs target/guest-init-benchmark/rootfs \
  --official target/firmware-official-compare-20261003/official \
  --trimmed target/firmware-official-compare-20261003/trimmed \
  --output target/vm-startup-new \
  --samples 100 --warmups 5 --profile-samples 20
The output directory must not exist. The harness uses the Python standard library and existing percentile/Bundle validation helpers. Main and diagnostic batches are separate, warmups are excluded, and outputs include results.json, incrementally flushed samples.jsonl, input hashes and per-trial stdout/stderr. Its schema is pvisor-vm-readiness/v1; do not mix it with startup.py command-completion measurements.
Local logs are in target/vm-startup-20261003/; the formal JSON report and previously public data files remain in the local archive described above. Historical persistence, entropy and firmware experiments remain under review_project/03-modules/. The older C/Rust guest-init runner comparison remains in benchmark/pvisor/README.md; it excludes full CLI preparation and is not directly comparable with this table.
The measured harness snapshot is retained in review_project/06-evidence/vm-startup-20261003/; the reusable harness subsequently added explicit pipe closure and PVISOR_STARTUP_TIMING=0 for uninstrumented samples; the snapshot preserves the measured implementation.
Linux / KVM
Use a prepared guest root and firmware directory with a new output directory. The script reuses first-output timing and run validation, copying the CLI and firmware to pin artifact identity.
python3 benchmark/pvisor/linux_vm_ready.py \
  --binary target/release/pvisor \
  --rootfs / \
  --firmware /path/to/libkrunfw-5.5.0-directory \
  --output target/vm-startup-linux-new \
  --samples 100 --warmups 5
Local raw record docs/src/assets/benchmarks/.data/startup-linux-20261003.tsv. Per-trial stdout/stderr, warmup logs and fixed binaries remain in local target/local-vm-validation-20261003/startup-linux-100/. Changing artifacts or rootfs requires a new measurement batch with earlier records retained.
6. Unmeasured scenarios
Docker, Firecracker, QEMU and controlled Agent tool loops now have same-host measurements; full Ubuntu first boot and part of preparation are reported separately. a3s, real model inference, large projects, public dependency downloads, cold disk caches, TUI, Gateway, concurrent density and application health checks still require separate matrices.