How can multiple VMs use less memory?
Motivation
Agent tools load dependencies, read files and process data, and several environments may use identical contents at the same time. pVisor shares duplicate pages early and keeps that sharing across later reads, cutting resident memory. Choose by the working set's lifetime: short-lived tools and long-lived library pages exercise different trade-offs.
In the shared-random preflight, the physical pool reaches the observed sustained 128 MiB drop at about 1.7 s, while KSM takes about 27.8 s and finishes with lower memory. Evaluate scanning CPU, end-of-window memory and private-RAM restoration cost together rather than one peak.
Experiment design
Measure whole-group charged memory over time, PSS and the cost of the first complete readback as memory occupancy. That occupancy is what the group costs while it runs; lower occupancy at the same readback cost fits more environments.
Four instances per group, 64 MiB of data each, inside a four-CPU / 2 GiB / zero-swap budget. VMs use 256 MiB and one vCPU; each container has a 256 MiB limit and one CPU quota. Each condition runs one 60-second window after readiness; content, private-write, exit and resource checks must pass, and incomplete cohorts are excluded.
Report whole-group totals. PSS allocates shared pages proportionally, and group-charged memory is the cgroup's memory.current; per-VM averages divide these totals by four and do not measure the marginal cost of another VM. Docker uses a dedicated rootless daemon, Firecracker and pVisor use different kernels and file paths, and global ksmd runs outside the group's CPU quota. Repeated rounds, real-Agent latency and long-term capacity remain unmeasured.
Distinguishing deduplication from compression
The labels below are experimental controls, not combinable options. Physical sharing works on 4 KiB pages; local and pooled compression use 64 KiB blocks and reject poorly compressible data. Immutable-file DAX maps one backing file directly, and file-read hints only prioritize scanner candidates.
| Experimental label | Memory mechanism | Cross-VM reuse | On subsequent reads |
|---|---|---|---|
off |
Extra RAM deduplication and cold compression disabled | No active RAM merging | Read existing pages |
ksm |
Host kernel scans and merges identical pages | Kernel-managed shared pages | Retain sharing; copy on write |
local |
Each instance compresses cold blocks and can deduplicate within its local store | No shared compressed objects across VMs | Restore instance-private RAM |
physical |
Daemon holds shared physical pages with identical contents | VMs map the same page | Retain sharing; copy on write |
compressed |
Daemon stores reusable compressed cold blocks | VMs reuse compressed objects | Restore instance-private RAM |
Data and analysis
Deduplication and shared-library curves
The static working-set curves include stock Firecracker, dedicated rootless Docker, and pVisor off, KSM, physical, compressed and local. Each of the three workloads has 0–60-second group-charged memory and PSS curves, with first-readback and CPU readings retained.
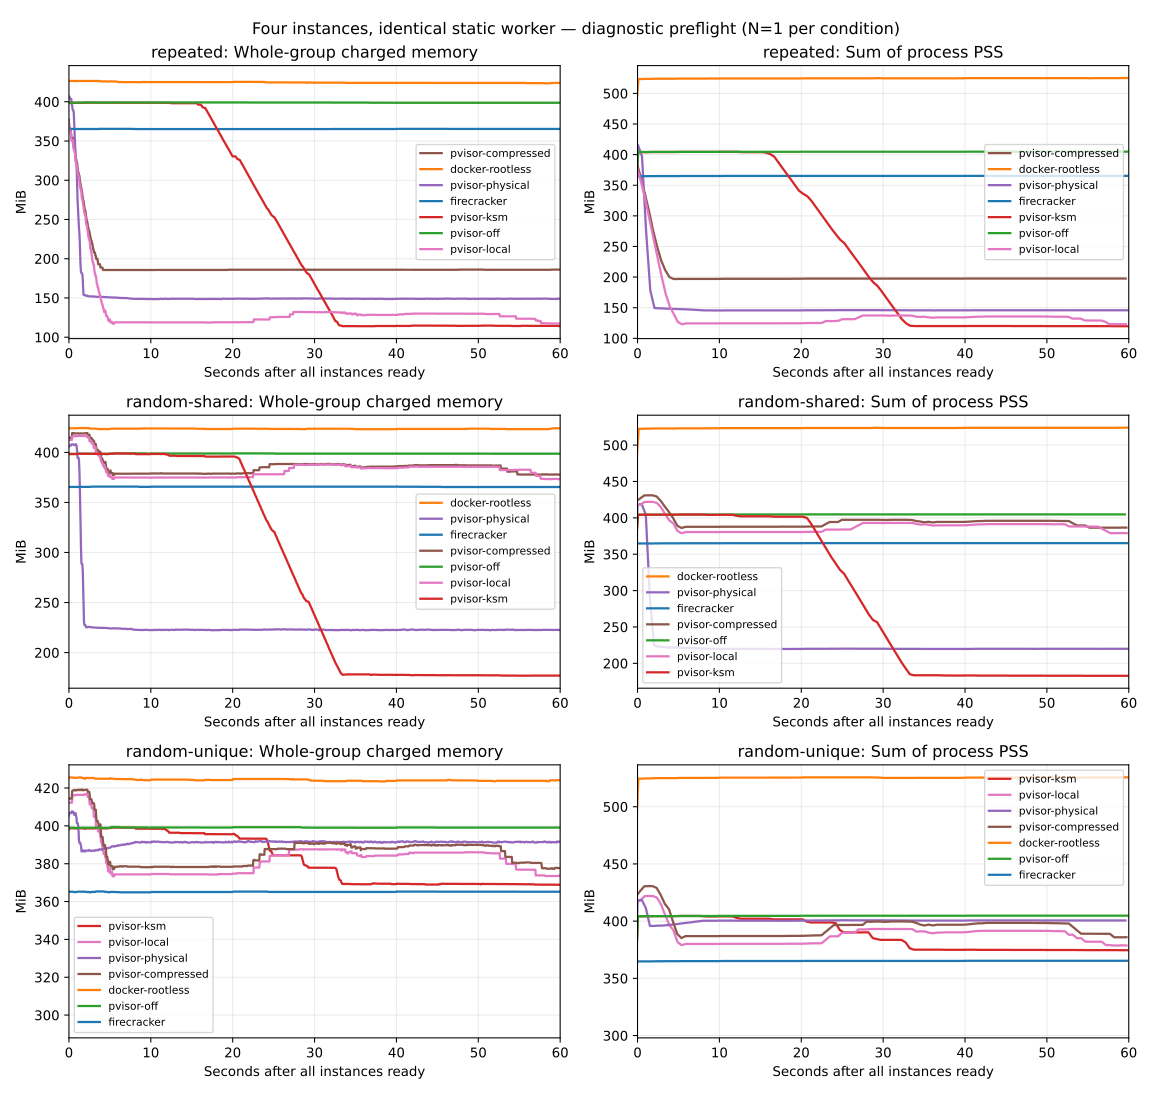
Rows show repeated contents, identical random contents across instances, and instance-unique random contents. The left column shows whole-group cgroup charges; the right column shows process PSS. The horizontal axis is seconds after all instances are ready, and the vertical axis is MiB, with N=1 per condition. The physical pool drops earlier for shared random contents, while KSM uses less memory at the end of the window. Unique random contents show limited sharing benefit.
Reclamation speed and CPU cost
The table uses identical random contents across instances, with N=1 per condition. Memory is whole-group charged MiB at 60 seconds; CPU is cumulative CPU seconds over the 60-second window. Reclamation time is the sampled interval for a 128 MiB drop from each condition's all-ready charge, sustained through the end of the window. “Not reached” means the target was not met within the window.
| Mode | Charged MiB at 60 s | Group CPU s | Time to sustained 128 MiB drop, s |
|---|---|---|---|
| firecracker | 365.67 | 0.164 | Not reached |
| docker-rootless | 423.99 | 0.183 | Not reached |
| pvisor-off | 398.91 | 0.386 | Not reached |
| pvisor-ksm | 177.33 | 0.384 | 27.723–27.773 |
| pvisor-physical | 222.61 | 5.924 | 1.688–1.739 |
| pvisor-compressed | 377.89 | 2.838 | Not reached |
| pvisor-local | 373.48 | 2.341 | Not reached |
KSM additionally has 0.41 CPU seconds of global ksmd work outside the group quota, which cannot be attributed entirely to this group. Group CPU includes VMs, the pool and in-group control work; these readings measure the complete path.
These curves trade reclamation speed against sustained cost. The physical pool reaches the observed target in about 1.7 s; KSM takes about 27.8 s but reads lower on memory and CPU at 60 s. Short-lived working sets place more value on memory released in the first few seconds; long-lived pages have more time to accumulate sharing benefits. Selection depends on shareable page lifetime and CPU budget.
This experiment does not measure real-Agent call-duration distributions or establish benefits for subsecond calls. Time to target is not the first merge or full convergence time; pages in persistent VMs can retain sharing across multiple tool calls.
Does readback preserve the saving?
These separate readings use repeated contents, with N=1 per condition and whole-group charged MiB. Complete readback time includes all four instances, full-byte and digest verification, and control transport.
| Mode | MiB before read | MiB after read | Complete read ms |
|---|---|---|---|
| pvisor-off | 398.92 | 399.09 | 621.99 |
| pvisor-local | 117.46 | 374.58 | 1157.44 |
| pvisor-compressed | 186.17 | 419.73 | 1099.13 |
| pvisor-physical | 149.14 | 149.10 | 839.57 |
Physical sharing retains low usage after reads but still incurs access costs. Compressed paths rise from their low idle readings as private RAM is restored; frequent reuse needs to account for that cost. The paths also differ in block size, admission and IPC, so their full timing difference cannot be attributed to the compression algorithm.
Shared libraries: file hints and DAX
The shared-library curves compare loading paths for the same .so, including file hints off/on and explicit DAX. Time starts when all instances are ready; sharing during startup appears in the initial footprint. Complete readback and private-write validation remain intact; post-write curves are omitted.
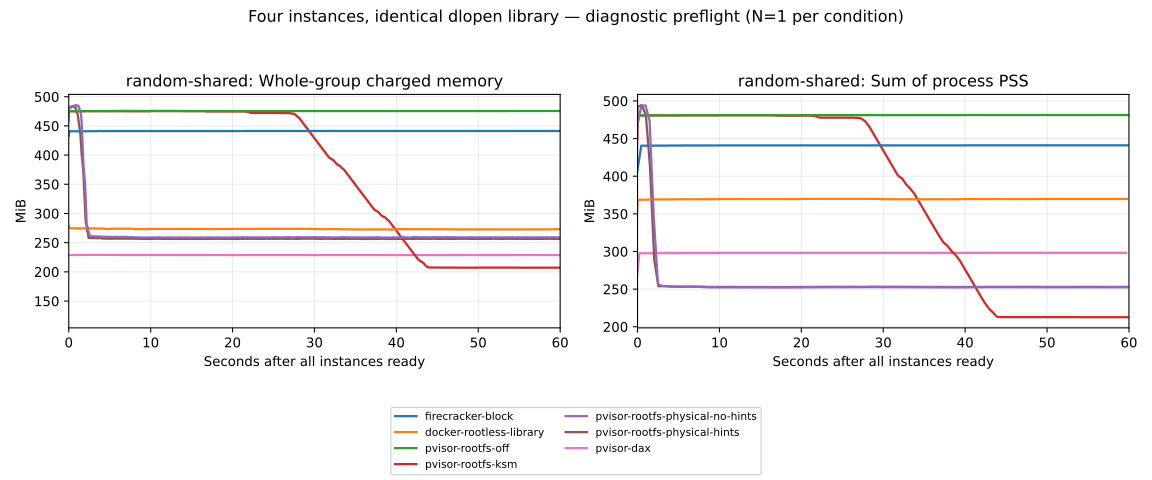
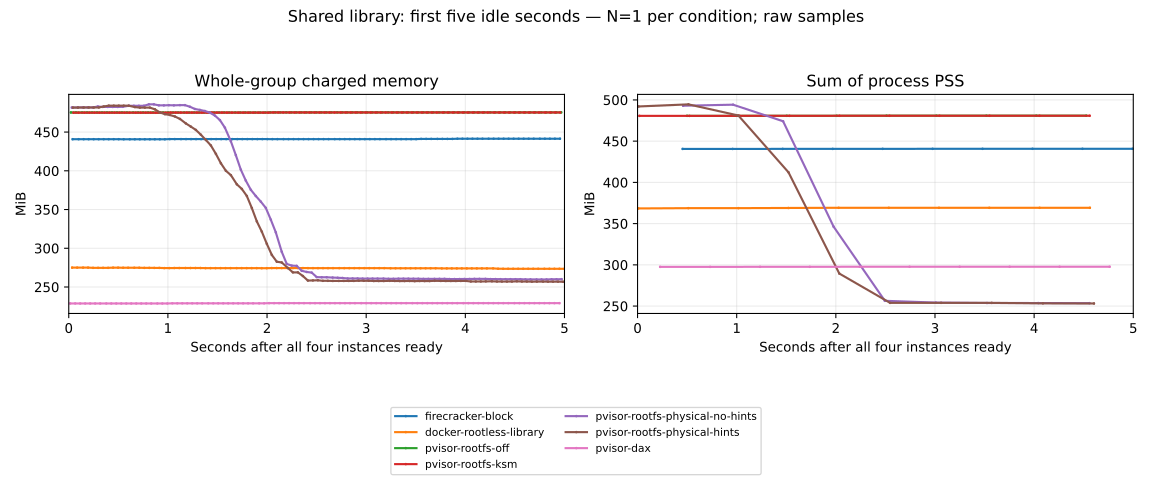
Both library figures use the same N=1 preflight and whole-group MiB on the vertical axes. The first-five-second view retains original samples to show early differences with file hints off/on; explicit DAX sharing is already reflected in the initial footprint. See the detailed analysis for scanning CPU and readback costs.
Sources and configuration
The memory experiment record retains current curve provenance and reproduction protocols. Failed attempts, incomplete repeated measurements and post-write evidence remain intact and excluded from successful preflights.
See the daemon guide to enable the physical pool and CLI control options for VM compression, deduplication and offload configuration.