Filesystem performance: technical analysis and experiment records
Historical cohorts retain their pinned sources, artifacts and timing scope. See the benchmark registry for active experiments and preparation status.
Note: "local original records" and paths such as
docs/src/assets/benchmarks/.data/andbenchmark/.data/refer to local measurement archives that are not published with the repository or the site; they are kept for batch provenance only.
Current conclusions and measurement coverage
In the latest independent N30 paired comparison, the current default configuration versus its own cohort baseline: start-to-clean-exit -1.73% (95% CI [-5.70, -0.22]), writing 256 files -14.19% ([-17.58, -9.82]). The historical filesystem regression is not yet fully repaired; write coalescing for new VMs and DAX are both off by default. Percentages below come from their own frozen baselines and cannot be summed across batches.
Batch coverage and conclusions follow.
The filesystem I/O curves compare request size, concurrency, synchronization, capacity and reuse working sets. Independent N30 and ordinary-CLI comparisons do not support enabling host-owned asynchronous batching by default; request counts distinguish backing coalescing from FUSE WRITE reduction.
The 2026-10-17 guest-kernel writeback followup fixes object lifetime for closed unlink/rename followed by syncfs, and verifies cross-batch progress with delayed backing. Historical statements below that ENOENT remains unresolved describe their own frozen versions; their timings, failures, and conclusions remain intact. The SDK fix does not establish a new ordinary-CLI WB=1 performance result.
Scoped automatic read-only FLUSH requests in ordinary CLI execution reduce the three-round seven-tool total by 7.26%, 95% CI [2.25%, 15.51%], with authenticated prepared rootfs/workspace and improvement in all five pairs. All rg rounds improve by approximately 16%–17%; Ready and npm show no detected difference. Eligible Linux x86_64 fresh native execution requests the feature when the host variable is absent; explicit 0, older peers and ineligible fds preserve the original FLUSH. DATA, NE, WB and DAX are not automatically enabled.
The ordinary-CLI standard negative-entry comparison, with DATA 0/FLUSH 1 fixed, did not establish an aggregate benefit: a 1.73% three-round seven-tool reduction, 95% CI [-3.45%, 5.26%]. Third-round npm improved 12.27%, while hot_open slowed 2.50%. Query reductions are verified; NE remains disabled by default.
The ordinary CLI DATA/readonly-FLUSH four-arm comparison, with prepared rootfs/workspace and the frozen baseline fixed, reduces cumulative three-round seven-tool time by 9.54%, 95% CI [3.83%, 13.31%]. FLUSH alone reduces it by 8.86%; adding DATA has no detected extra overall benefit. All rg rounds improve, with local metadata/Ready regressions. DATA remains off by default; readonly FLUSH is now connected for the scoped prepared-rootfs entry, while the generic VM worker remains default-off.
The ordinary CLI sealed-workspace entry reduces cumulative three-round seven-tool time by 5.21%, 95% CI [0.44%, 10.91%], with prepared rootfs in both arms and improvement in all five pairs; Ready detects no difference. Workspace ownership/cache eligibility and frozen-baseline read-observation/journal semantics change jointly. Round 3 git falls by 73.74%, while Round 2 stream_write is 5.05% slower; gains cannot be combined with independent cohorts.
The ordinary CLI prepared-rootfs entry reduces cumulative three-round seven-tool time by 18.11%, 95% CI [2.00%, 31.90%], and Ready by 3.26%, using the same sealed physical rootfs and live Mutable workspace. All five pairs improve. Ownership/cache eligibility and checkpoint capability/admission change jointly; preparation is outside the clocks, so the gain cannot be attributed solely to cache or extended to arbitrary live rootfs directories.
Same-OPEN qualification reuse reduces the four measured qualification-query attempts by 57.14%, without a detected improvement in cumulative three-round seven-tool time, Ready, npm, or rg; the candidate remains off by default.
Standard negative-entry caching shows a 13.08% third-round npm improvement signal. Cumulative three-round seven-tool time falls by 3.32%, with an interval crossing zero and no detected overall gain. Independent counters reduce cumulative rootfs LOOKUP by 40.26%; the preference remains disabled by default. This enabled combination has no formal ordinary CLI performance samples; the separate prepared-rootfs CLI comparison keeps the new experimental mechanisms disabled.
The same-batch data-cache/local-FLUSH four-arm comparison supports about 36% lower rg time in each round, with gains over either mechanism alone. All three primary cumulative intervals cross zero; separated observations and slow samples remain. Both defaults were off in that SDK entry; the current scoped prepared-rootfs default is covered by automatic FLUSH requests.
Isolated Immutable-lower data caching resolves the exercised lower/upper page-mixing cases and reduces third-round workspace READ by 88.83%. rg improves by about 17% in each round, with no detected cumulative seven-tool gain; that cohort does not cover the ordinary CLI, and the feature remains disabled by default.
Read-only local FLUSH elision shows about 17% improvement in each rg round; the cumulative three-round seven-tool interval still crosses zero. The generic VM worker remains default-off; the scoped prepared-rootfs entry now requests FLUSH automatically.
The exclusive-upper physical-absence cache reduces third-round rootfs queries by 71.47%, with no detected cumulative seven-tool gain and a regression signal in rg; it remains disabled by default.
The rejected attribute-TTL candidate and page-cache isolation diagnostics establish new stale hardlink nlink from the removed candidate, with no formal performance samples, and an existing lower/upper page-cache isolation gap.
The 2026-10-16 Ready and three-resident-round comparison has five independent environments for each of nine configurations, three rounds per environment, 45 successful environments and no interference gate. Startup uses Ready only; resident operation clocks exclude exit. It remains independent of the historical N30 and engineering A/B below.
The four-arm owned-input engineering comparison supports resident-tool gains from rootfs cache eligibility: the third-round seven-tool sum falls by 25.80%, or 19.83% with the workspace snapshot also enabled. Workspace treatment alone has no detected difference in the third-round sum. Its engineering entry omits the CLI Host service; these results leave ordinary CLI user tables unchanged.
The Immutable-lower negative-cache comparison reduces third-round rootfs physical queries by 20.47%, with no detected difference in cumulative three-round seven-tool time. Negative caching remains disabled by default.
Directory-FD cache capacity and ATIME diagnostics find no detected improvement in the cumulative three-round seven-tool time; default capacity remains 256. An independent request-mask probe confirms that stat requesting ATIME adds GETATTR after the first host READ, while a page-cache hit on the same fd adds none.
Latest independent N30 paired comparison (the cohort cited in this section's opening sentence; details): Selected C3 (new-VM writeback off by default): Launch through normal exit changes by -1.73%, 95% CI [-5.70, -0.22]%; Write 256 files changes by -14.19%, 95% CI [-17.58, -9.82]%. Results apply to the measured combined code/default configuration; complete recovery of historical performance is not established.
Independent cohorts: Linux: paired N30 comparison of filesystem optimizations with default-off writeback. The existing overview retains each historical cohort's conclusions.
Historical engineering conclusions:
The filesystem regression remains unresolved overall. The small direct-queue retest supports improvements in some tools, with no detected overall task difference. Disabling writeback reduces write cost but has no detected speedup for the complete seven-tool task. DAX retains explicit opt-in and is disabled by default; first mmap and repeated small-file reads regress clearly.
Each row below uses its own same-condition cohort. Percentages cannot be added, and absolute times cannot be compared across cohorts. Change is candidate relative to that cohort's baseline; negative means less time. Intervals are paired-bootstrap 95% percentage intervals. Direct queues have N=10 per arm; other rows have N=30 per arm. All rows are engineering results.
| Comparison / metric | N per arm | Baseline ms | Candidate ms | Change | 95% CI % | Conclusion |
|---|---|---|---|---|---|---|
| Staged idle dispatch: completion | 30 | 1826.42 | 1774.15 | -2.86% | [-3.57, -1.22] | faster |
| VM worker fix: completion | 30 | 4741.87 | 4592.36 | -3.15% | [-6.14, -1.23] | faster |
| VM concurrency refactor: internal total | 30 | 3578.18 | 3749.07 | +4.78% | [+2.96, +5.92] | slower |
| VM direct queues: internal total | 10 | 3707.29 | 3606.71 | -2.71% | [-5.28, +7.25] | no detected difference |
| Writeback disabled: write | 30 | 162.10 | 131.61 | -18.81% | [-25.06, -12.87] | faster |
| DAX enabled: repeated sequential read | 30 | 5.54 | 4.58 | -17.38% | [-21.40, -10.10] | faster |
| DAX enabled: first parallel read | 30 | 54.43 | 38.27 | -29.69% | [-32.16, -28.25] | faster |
| DAX enabled: first mmap page traversal | 30 | 23.83 | 104.75 | +339.59% | [+328.77, +352.40] | slower |
| DAX enabled: repeated small-file read | 30 | 25.37 | 36.63 | +44.37% | [+36.47, +47.98] | slower |
Ordinary rootfs/workspace attachments allocate no DAX window by default; immutable shares retain explicit DAX configuration. New VM writeback defaults to disabled, with explicit PVISOR_VM_FS_WRITEBACK=1 / 0 configuration. By default, restoring a negotiated snapshot retains its mode; explicit PVISOR_VM_FS_WRITEBACK=0 rejects a snapshot with writeback enabled. Stage synchronization defaults to serial. Historical engineering artifacts and conditions remain intact; their percentages are not summed or used to rescale current user results.
The selected frozen source/defaults completed the cross-runtime seven-tool cohort on 2026-10-12: thirty trials for each of eight backends, totaling 240 valid tasks, with DAX disabled and new VM writeback disabled by default; see the local historical N30 statistics. These user data come from independent cohort fo5a4e7d2b-f, without pooling history or deriving cross-cohort causal speedups. Earlier accepted and rejected attempts remain in the local acceptance CSV.
macOS responsiveness during copying and journal locks and Linux HOST immutable-lower caching have separate valid experiments. Extended kernel caching has passing correctness and request-count evidence, with no accepted formal timing. Cold disks, large repositories and concurrent throughput lack matching new measurements. The local engineering evidence CSV retains each table row's cohort, metric, source and full precision.
Linux: scoped automatic read-only FLUSH requests in ordinary CLI execution
With the same prepared rootfs/workspace and frozen baseline, leaving the host preference absent so the native child automatically requests read-only FLUSH elimination reduces the three-round seven-tool total from 4489.439 to 4163.340 ms: 7.26%, 95% CI [2.25%, 15.51%]. All five environment pairs improve, with approximately 16%–17% reduction signals for rg in every round. Ready, all three npm rounds and the second/third-round seven-tool totals show no detected difference.
Same artifacts and an actually absent caller preference
On 2026-10-17, B-FS-ENG uses the same newly built actual CLI release, retained 0047 firmware and existing catalog-authenticated, leased prepared rootfs/workspace. The workspace keeps its frozen baseline and independent live apply target. Existing prepared generations are not reimported or sealed again; each environment’s independent live apply target and caches are prepared according to the original workload. No earlier samples or percentage gains are pooled; the new build, original preparation and current execution clocks have separate receipts.
Both arms run real pvisor run, a fresh private Host and native VM on Linux x86_64/KVM. The off arm explicitly sets PVISOR_VM_FS_READONLY_FLUSH_ELISION=0. The auto arm omits that key from both the actual worker environment and the exact environment passed to CLI Popen. The product sets 1 only for the native child after authenticating the prepared-rootfs selector, matching owner/root and final Immutable lower, and confirming fresh execution without capture/restore. Per-mount requested/enabled counters independently verify negotiation; expected configuration cannot replace actual environment evidence.
The guest has 2 vCPU/16 GiB; the parent group has CPU 0/1, a two-core quota, 16 GiB and swap 0. DATA, NE, SQ, both Core absence caches, WB and DAX are 0; guest cache=1 and directory-FD capacity 256. Five paired environment blocks run in seeded randomized order, with nine operations and three resident rounds per environment. All 10 timing, 2 preflight and 2 independent profile environments pass. The new release has 29 passing runtime contracts and 7 harness contracts, with 46 collection inputs and 740 product sources bound by receipts.
Ready includes fresh Host+VM startup and excludes exit. Tools keep their original worker clocks; stream_write retains its own fsync/close. Checks retain unique Ready/Result, normal exit, terminal Job/Bundle, selectors/baseline receipt, lower/cache isolation and complete bytes for 256 written files and three stream files. There is no extra prewarming, quiet period, interference gate or per-round full inventory gate. Every valid slow sample remains.
Timing and distributions
The sole primary metric is the three-round seven-tool total within each environment. The 5000 paired bootstrap draws resample five independent environment blocks; the rounds are not 15 independent samples. All 32 intervals are uncorrected for multiple comparisons. Values below are per-arm N=5 medians; positive reductions mean less elapsed time.
| Metric | off ms | auto ms | Reduction | 95% CI % | Finding |
|---|---|---|---|---|---|
| Three-round seven-tool total | 4489.439 | 4163.340 | 7.26% | [2.25, 15.51] | Sole primary; reduction |
| Ready | 826.914 | 821.821 | 0.62% | [-0.32, 14.10] | Not detected |
| Round 1 seven tools | 2164.014 | 2007.672 | 7.22% | [3.90, 12.96] | Uncorrected reduction signal |
| Round 2 seven tools | 1113.353 | 1035.975 | 6.95% | [-2.04, 19.07] | Not detected |
| Round 3 seven tools | 1063.282 | 1026.175 | 3.49% | [-4.56, 25.84] | Not detected |
| Round 1 rg | 311.544 | 258.499 | 17.03% | [15.79, 17.77] | Uncorrected reduction signal |
| Round 2 rg | 303.683 | 251.471 | 17.19% | [9.75, 18.85] | Uncorrected reduction signal |
| Round 3 rg | 301.652 | 252.247 | 16.38% | [11.09, 18.22] | Uncorrected reduction signal |
Other reduction signals are git rounds 1/3: 23.56% [12.00%, 28.00%] and 14.15% [8.41%, 29.65%], round 1 hot_open: 1.50% [0.10%, 2.51%], and round 1 stream_write: 4.16% [3.32%, 10.88%]. No interval lies entirely on the regression side. The remaining 23 comparisons show no detected difference, including every npm, metadata and write round. The single-round stream_write signal does not establish faster write barriers or changed durability semantics.
The five paired aggregate values, in milliseconds and matching pair order, are off [4574.077387,4489.657213,4271.683726,4266.578114,4489.439478] and auto [3864.449358,3996.902372,4170.722363,4170.459189,4163.340428]. All 64 complete five-value vectors remain available. N=5 and this interval do not establish stable workload guarantees or tail latency.
Write observations have clear gaps. For description only, splitting at 120 ms gives round 2 off a lower 2/5 group (median 88.163 ms) and upper 3/5 (156.564), versus auto lower 4/5 (78.897) and upper 1/5 (142.706). Round 3 off has lower 3/5 (78.849) and upper 2/5 (155.293), versus auto lower 3/5 (90.097) and upper 2/5 (152.492). These are exploratory descriptions, not a preregistered model, exclusion rule or cause. The round 2 write median point estimate of 45.21% is not a detected benefit.
The off Ready arm retains its 956.412 ms observation; its other four values are 821.542–829.375 ms, versus auto 819.801–826.299 ms. Metadata is also dispersed: round 3 off 96.469–147.020 ms and auto 76.363–138.723 ms, without a detected difference. All slow observations remain; small samples do not establish stable clusters.
Independent counts: FLUSH coverage and added qualification work
Each arm's N1 profile has 13 registered instances and exactly one final per instance, 54 synchronous tokens per mount and 216 component intervals per environment. Together they cover 26 instances, 216 frames and 432 intervals. Actual worker/CLI environments establish explicit off 0 versus absent auto. Both rootfs/workspace report FLUSH requested/enabled 0/0 versus 1/1; DATA/NE and their object/reply counts are explicitly 0.
| Round 3 seven tools / mount | OPEN off→auto | READ | FLUSH | RELEASE |
|---|---|---|---|---|
| rootfs | 1052→1052 | 0→0 | 1028→0 | 1052→1052 |
| workspace | 2681→2681 | 2480→2480 | 2681→542 | 2682→2682 |
Rootfs FLUSH in rounds 1/2 is 1160/1028→0/0; workspace is 4785/2681→563/542. OPEN, READ and RELEASE remain unchanged for the seven-tool total in every round. Workspace rg has FLUSH 2051→1 each round while OPEN/READ/RELEASE remain 2051 each. Rootfs npm has FLUSH 731→0, OPEN/RELEASE 736 unchanged and READ 774/0/0 unchanged. Read-only FLUSH elimination does not remove these OPENs or repeated data reads.
Over entire mounted-owner lifetimes, actual marked OPENs are 3680 for rootfs and 8501 for workspace; off has 0. Auto adds 36543 attempts across the four native qualification queries: F_GETFL, fstat and fstatfs each 12181, statx 0; rootfs accounts for 11040 and workspace 25503. The three-round seven-tool intervals contain 35412 attempts, a different scope. Core parent/leaf queries remain separate from these four calls; classification counters and inclusive spans are not added to their total. Counts establish neither time shares nor disk I/O.
Other N1 request shapes are not identical: round 3 workspace rg GETATTR 237→3 and Core 13721→12323, while rootfs npm GETATTR 383→396 and Core 20013→20063. These differences cannot be claimed as direct FLUSH elimination. Workspace metadata keeps 2050 GETATTR in rounds 2/3; stream_write keeps 8192 WRITE, 1 FSYNC and 3 FLUSH each round. The native main compact journal retains 345 append, 1276 transaction, 1277 refresh and 8 sync calls in each arm; the initialization owner has the same separate refresh/sync. Task intervals and full owner lifetimes remain separate, and profile clocks do not enter timing samples.
Scope of the automatic request
The product default applies only to Linux x86_64 fresh native execution with an authenticated prepared rootfs and exact owner/root/final-lower match, when the caller leaves the preference absent. Explicit 0 preserves the original behavior. Older guests and ineligible fds retain backend FLUSH, and guest write synchronization/error checks remain. SDK calls without a selected and authenticated prepared rootfs (including calls supplying only a with_rootfs_base owner), and macOS keep their previous unset behavior. Capture/restore retain the source's existing rejection contract. DATA, NE, SQ, Core caches, WB and DAX are not automatically enabled.
The unchanged VM/0047 mechanism can reuse existing SDK evidence for old lower fds/full-page copy-up, mmap/close, ATIME and older peers; this is not a rerun of a new CLI semantic matrix. Existing fstat object semantics and copy_file_range limitations remain unresolved. The 19 short-read C-program checks do not constitute complete kernel fault injection. These results support the scoped CLI read-only FLUSH default, without extending it to arbitrary SDK callers, live lowers, long TTLs or writeback policies.
Timing summary, all 32 comparisons and timing provenance retain every sample. Per-tool counts, owner lifetimes and count provenance retain independent N1 and actual caller evidence. Raw reports, new artifacts and original preparation-cost associations remain local in benchmark/.data/af17-cli/; earlier cohorts are not pooled.
Linux: standard negative entries through the ordinary CLI
With DATA=0 and readonly FLUSH=1 fixed, standard negative-entry caching did not establish a three-round seven-tool aggregate benefit: 4132.526→4060.983 ms, a 1.73% reduction, 95% CI [-3.45%, 5.26%]. Third-round npm showed a 12.27% improvement signal, unsupported by the first two rounds; third-round hot_open was 2.50% slower. NE remains disabled by default.
Identical sources and timing scope
On 2026-10-17, B-FS-ENG compared NE=0/1 through real pvisor run, a fresh private Host, VmExecutor and the native runner. Both arms reused one verified GNU CLI release, 0047 firmware and catalog-authenticated, leased prepared rootfs/workspace generations; the workspace retained its frozen baseline and independent live apply target. No new build, import or sealing occurred. Original preparation receipts describe existing costs; no old timing or other cohort's gains enter this result.
Linux x 86_64/KVM, guest 2 vCPU/16 GiB, whole-parent CPU 0/1 with a two-core quota, 16 GiB and zero swap; guest cache=1 and directory-FD capacity 256. DATA, SQ, both Core absence caches, WB and DAX were 0; readonly FLUSH was fixed at 1. Standard negatives use inode 0, a one-second entry TTL and attribute TTL 0, without adding a private peer capability or extending positive/attribute TTLs.
Each arm used five fresh private Host/VM environments with nine operations over three rounds, in seeded randomized order within five environment blocks. All 10 formal environments, 2 correctness checks and 2 independent counter environments passed. Validation retained unique Ready/Result, normal exit, terminal Job/Bundle, actual selectors/baseline receipt, lower/cache isolation and complete bytes for all 256 written files and three stream files. Independent namespaces, pivot roots and Host authorities left existing user listeners untouched.
Ready includes fresh Host+VM startup and excludes exit. Tasks retain their original worker clocks, including stream_write's own fsync/close. Formal timing disabled profiling, with no extra warmup, quiet period, interference or per-trial full-inventory gate; every valid slow observation remains. Only the per-environment three-round seven-tool sum is primary. All 32 95% intervals are uncorrected; 5000 paired bootstrap draws resample five environment blocks. Three rounds do not constitute 15 independent samples.
No aggregate effect detected; individual signals retained
| Metric | NE off ms | NE on ms | Reduction | 95% CI % | Finding |
|---|---|---|---|---|---|
| Three-round seven-tool sum | 4132.526 | 4060.983 | 1.73% | [-3.45, 5.26] | Primary; not detected |
| Ready | 830.839 | 825.440 | 0.65% | [-0.35, 11.50] | Not detected |
| First-round npm | 739.523 | 701.769 | 5.11% | [-6.54, 5.81] | Not detected |
| Second-round npm | 484.441 | 500.858 | -3.39% | [-22.46, 16.88] | Not detected |
| Third-round npm | 511.013 | 448.324 | 12.27% | [0.37, 20.88] | Uncorrected improvement signal |
| Third-round hot_open | 10.210 | 10.466 | -2.50% | [-2.50, -0.66] | Uncorrected regression signal |
The other 30 intervals cross zero, including every rg, stream_write and per-round seven-tool sum. The five paired aggregate values (ms, matching pair order) are off [4132.525580,3925.428389,4211.135883,4211.219659,4130.488754], on [4132.123292,4060.983456,4127.717011,3992.961109,3913.385616]. Four pairs decreased and one increased; one saved only 0.402 ms and another cost 135.555 ms. Third-round npm improved in all five pairs, but one saved only 1.737 ms; hot_open slowed in all five. Favorable results cannot be retained selectively.
Write samples have visible observation gaps. In round 2, the off arm has 2/5 lower values, median 78.788 ms, and 3/5 higher values, 150.504 ms; on has 1/5 lower, 78.646 ms, and 4/5 higher, 152.404 ms. In round 3, off has 2/5 lower, 78.530 ms, and 3/5 higher, 143.744 ms; on has 2/5 lower, 82.954 ms, and 3/5 higher, 146.267 ms. On-arm round 2 metadata includes 76.749 ms with the other four at 137.968–151.234 ms; off-arm Ready retains 923.247 ms with the other four at 824.922–833.673 ms. N=5 cannot establish stable clusters, tails or causes. All original values remain.
Queries removed and work that remains
Each arm's independent N=1 counter environment has 13 registered instances with unique finals, 54 synchronization tokens per mount and 216 component intervals per environment; together 26 instances, 216 frames and 432 intervals. Both requested and enabled NE values are 0 in the off arm and 1 in the on arm; DATA is 0 with no object/mark activity, and FLUSH is 1. Full-lifetime readonly-FLUSH marks are rootfs 3680 and workspace 8501, identical across arms.
| Three-round seven-tool scope / mount | NE off | NE on |
|---|---|---|
| rootfs LOOKUP | 3384 | 2023 |
| rootfs Core parent+leaf queries | 82206 | 64295 |
| workspace LOOKUP | 1176 | 1129 |
| workspace Core parent+leaf queries | 127565 | 127098 |
Rootfs npm LOOKUP counts by round are 1335→882, 953→532 and 934→513. Third-round npm changes MissingLeaf 667→246, parent-identity attempts 5811→3012 and Core parent+leaf queries 20063→14465; GETATTR 396, OPEN/RELEASE 736 each, READ/FLUSH 0 and 2208 attempts across four native qualification query kinds remain. Third-round seven-tool rootfs LOOKUP is 947→521 and Core 21652→16014; workspace LOOKUP 306 and Core 36962 are unchanged.
Three-round seven-tool rootfs OPEN/READ/FLUSH/RELEASE remain 3304/1231/0/3304; workspace remains 9859/9520/1647/10144. Both arms' full native-journal lifetimes remain append 345, transaction 1276, refresh 1277 and sync 8. Counts establish fewer missing-path queries while substantial OPEN, attribute and other work remains; they do not give time shares or disk I/O.
Across full owner lifetimes, NE-on replies are rootfs 1056 and workspace 421, with path fallbacks 14 and 0. Replies are neither guest hits, unique missing names nor saved LOOKUPs; dividing 1361 fewer rootfs seven-tool LOOKUPs by 1056 replies would not yield a hit rate. Workspace first-round npm has 70 replies while LOOKUP changes 140→142. Kernel negative hits, per-errno and per-rejection-reason counters are unavailable; fallback counts cover only protected prefixes or backend fallbacks on enabled paths. Counter scopes include checked child startup, work and validation, wider than worker clocks; inclusive spans are not added.
Boundaries and the next candidate
Existing SDK diagnostics with the same mechanism source cover TTL expiry, namespace mutations, failed rename, permissions, Mutable external creation and exclusion ancestors/subtrees. Their DATA 1/FLUSH 1 differs from this CLI's DATA 0/FLUSH 1; they are not new complete ordinary-CLI semantic acceptance. New CLI environments passed their original output, source, Bundle and full-byte contracts. Existing namespace-fd attributes, copy_file_range, short-read primitive stubs and legacy page-isolation limits remain; WB's unlink→syncfs ENOENT is not fixed here, and WB stayed 0.
The evidence does not support default-enabling NE or blindly expanding caches. Static inspection identifies a narrower candidate: reuse complete Immutable parent-identity vectors within one resolution to avoid repeating ancestor queries when a miss assembles its proof. Mutable/upper final rechecks, merged visibility, permission/alias and failure behavior must remain. This candidate has not been implemented or measured.
Timing summary, all 32 comparisons and timing provenance retain 64 five-value vectors; per-tool counts, owner lifetimes and counter provenance retain independent N=1 evidence. Raw samples, prior artifact associations and new audits remain locally under benchmark/.data/cne17-cli/.
Linux: ordinary CLI data-cache/local-FLUSH four-arm comparison
With authenticated prepared rootfs/workspace and the frozen baseline held fixed, enabling DATA and readonly-FLUSH elision reduces cumulative three-round seven-tool time from 4403.334 ms to 3983.409 ms: 9.54%, 95% CI [3.83%, 13.31%]. FLUSH alone reduces it by 8.86%; adding DATA to FLUSH has no detected extra overall benefit. Combined rg gains are 33.93%–36.55% across the three rounds, with improvement signals over either mechanism alone. DATA remains default-off; readonly FLUSH now has automatic requests in the scoped prepared-rootfs entry, while the generic VM worker remains default-off.
Fixed sources, two mechanism preferences
On 2026-10-17, B-FS-ENG compares four arms through actual pvisor run, fresh Host, VmExecutor and native runner execution. All arms reuse one validated GNU release CLI, 0047 firmware and physical rootfs/workspace generations; both public selectors are catalog-authenticated and leased. The workspace remains a single Immutable lower and frozen baseline with an independent live apply target. Ownership and read-observation/journal semantics stay fixed across treatments.
Linux x86_64/KVM, guest 2 vCPU/16 GiB, parent budget CPU 0/1 with two-core quota, 16 GiB and swap 0; guest cache=1 and directory-FD capacity 256. SQ, standard negative entries, both Core absence caches, WB and DAX are 0. Only independent lower DATA and readonly backend-FLUSH elision preferences vary:
| Condition | DATA | Readonly-FLUSH elision |
|---|---|---|
| base | 0 | 0 |
| data | 1 | 0 |
| flush | 0 | 1 |
| both | 1 | 1 |
Each arm has five fresh private Host/VM environments, randomized within five environment blocks, with nine operations across three resident rounds. All 20 formal environments, 4 correctness preflights and 4 independent counter environments pass unique Ready/Result, normal exit, terminal Job/Bundle, actual selector/baseline receipt, lower isolation and complete written/stream-byte checks. Each sample has its own namespaces, pivot_root and Host authority, without reusing the user's listener.
Ready includes fresh Host+VM startup; workers retain their original internal clocks, and both exclude exit. stream_write retains its own fsync/close. Formal timing disables diagnostics, with no extra warmup, quiet-period, interference or per-round full-inventory gates; every valid slow sample remains. No new build, import or sealing occurs. The earlier approximately 1.415 s workspace preparation and older rootfs preparation scope refer only to their original receipts, without charging them as newly incurred costs or importing old timings.
Cumulative gains and local differences
The aggregate sums all three seven-tool rounds within each environment before taking the median across five environments. Only the first three aggregate contrasts below are preregistered primary metrics; the other two aggregates and all individual metrics are supplemental. Five contrasts×32 metrics produce 160 uncorrected 95% intervals. The 5000-draw paired bootstrap samples environment blocks; three rounds are not 15 independent samples. All 128 five-value vectors remain. These pairwise differences do not estimate an interaction or permit adding/multiplying gains from other CLI entries or SDK cohorts.
| Three-round seven-tool aggregate: baseline → candidate | Baseline ms | Candidate ms | Reduction | 95% CI % | Scope and conclusion |
|---|---|---|---|---|---|
| base → both | 4403.334 | 3983.409 | 9.54% | [3.83, 13.31] | Primary; all five pairs improve |
| flush → both | 4013.044 | 3983.409 | 0.74% | [-3.02, 2.77] | Primary; no detected difference |
| data → both | 4208.870 | 3983.409 | 5.36% | [2.62, 8.30] | Primary; all five pairs improve |
| base → data | 4403.334 | 4208.870 | 4.42% | [-2.28, 6.49] | Supplemental; no detected difference |
| base → flush | 4403.334 | 4013.044 | 8.86% | [4.36, 11.53] | Supplemental; all five pairs improve |
The two mechanisms complement each other for rg: all three combined intervals exceed zero against the disabled arm and either single mechanism. Cells below give time reduction and 95% CI. Combined medians versus disabled are 312.027→199.419, 299.491→197.878 and 305.158→193.608 ms.
| rg round | base → both | flush → both | data → both |
|---|---|---|---|
| 1 | 36.09% [35.42, 36.76] | 23.35% [20.25, 24.80] | 22.49% [21.28, 23.19] |
| 2 | 33.93% [28.74, 36.31] | 20.97% [19.47, 26.01] | 22.26% [20.23, 24.90] |
| 3 | 36.55% [34.52, 38.17] | 22.08% [19.39, 23.76] | 20.86% [17.60, 24.75] |
Base→both detects no npm difference in any round. Base→flush Round 3 npm does fall from 512.552 to 473.029 ms:7.71%, CI [2.77%, 21.26%], an uncorrected individual signal, so npm cannot be described as having no gain in every contrast. All 15 stream_write intervals—three rounds×five contrasts—cross zero; no sequential-write improvement or regression is established.
Base→both Ready is 827.932→826.950 ms, reduction 0.12%, CI [-12.72%, 2.35%], with no detected difference. Three other uncorrected intervals signal regression; a negative reduction means slower:
| Contrast / metric | Baseline ms | Candidate ms | Reduction | 95% CI % |
|---|---|---|---|---|
| flush → both / Ready | 824.493 | 826.950 | -0.30% | [-9.98, -0.17] |
| base → flush / Round 2 metadata | 138.278 | 139.915 | -1.18% | [-26.85, -0.20] |
| flush → both / Round 3 metadata | 137.446 | 149.483 | -8.76% | [-92.88, -5.21] |
Write and attribute observations are visibly separated, limiting a single median's interpretation. The observed gaps describe the lower/higher Round 2 write groups below; they are not a preregistered stable-cluster model and do not attribute costs to host interference or a mechanism.
| Round 2 write condition | Lower observations / group median ms | Higher observations / group median ms |
|---|---|---|
| base | 4/5 / 80.090 | 1/5 / 157.763 |
| data | 3/5 / 79.654 | 2/5 / 140.320 |
| flush | 3/5 / 79.220 | 2/5 / 128.578 |
| both | 1/5 / 79.122 | 4/5 / 145.552 |
Flush Round 3 metadata also has 2/5 lower observations, group median 76.880 ms, and 3/5 higher observations, 138.501 ms. Both Ready retains a single 943.019 ms value; the other four are 817.904–829.986 ms. N=5 does not establish stable mixtures, tail latency or causes. All observations remain, with no retrospective exclusions or write claims based only on one P50.
Independent request counts confirm actual coverage
Each arm has one separate diagnostic environment with 13 registered instances and one final each, 54 synchronous tokens per mount and 216 component intervals per environment:52 instances, 432 frames and 864 intervals across four arms. Every rootfs/workspace owner explicitly reports the requested/enabled settings matching its arm, SQ/negative/Core controls 0 and capacity 256. Intervals include checked child startup, work and original validation; they are not worker_ms. Diagnostic clocks do not enter formal samples, and inclusive spans are not summed.
| Round 3 seven tools / mount / protocol calls | base | data | flush | both |
|---|---|---|---|---|
| workspace READ | 2480 | 277 | 2480 | 277 |
| workspace FLUSH | 2681 | 2681 | 542 | 542 |
| workspace OPEN / RELEASE | 2681 / 2682 | 2681 / 2682 | 2681 / 2682 | 2681 / 2682 |
| rootfs READ | 0 | 0 | 0 | 0 |
| rootfs FLUSH | 1028 | 1028 | 0 | 0 |
| rootfs OPEN / RELEASE | 1052 / 1052 | 1052 / 1052 | 1052 / 1052 | 1052 / 1052 |
Round 3 rg workspace READ and FLUSH each fall from 2051 to 1, with 2050 DATA markings and reuses; OPEN and RELEASE each remain 2051. Each mechanism alone removes its corresponding requests. Every owner's object/capacity rejections are 0. Over full instance lifetimes, the DATA arm has 873 rootfs registrations, 2807 reuses and 3680 marked opens; workspace has 2157, 6344 and 8501. Enabled FLUSH arms mark the same respective totals. Lifecycle counts include startup/teardown outside task intervals and cannot be mixed with seven-tool phase counts.
RPC savings add qualification work: Round 3 seven-tool attempts across both mounts for the four native qualification-query classes are base 0, data 12764, flush 9573 and both 22337. These are separate from Core parent/leaf software queries; Core counts are neither the entire OPEN cost nor disk I/O. All four native workspace-journal lifetimes retain append 345, transaction 1276, refresh 1277 and sync 8. No further journal elimination occurs; preimage/journal spans also do not count durable writes.
Metadata Rounds 2/3 retain 2050 workspace GETATTR each in all four arms. Every stream_write retains 8192 WRITE, 1 FSYNC and 3 FLUSH. The mechanisms do not remove those attribute queries or writable close barriers, and counts cannot be converted to time shares.
A descriptive partition of the seven nonoverlapping worker clocks across all five environments and three rounds gives base npm/rg shares of 40.82%/20.74%, and both shares of 43.67%/14.71%. This is neither a new paired metric nor inclusive-profile attribution; a higher npm share does not imply it became slower. The combined arm’s separate Round 3 rootfs npm still has 934 LOOKUP, 667 MissingLeaf and 20063 Core parent/leaf queries; READ/FLUSH are 0, OPEN/RELEASE are 736 each, with 5152 additional attempts across the four qualification-query classes. Actual CLI missing-name queries are a useful next candidate, with attribute GETATTR and write barriers diagnosed separately; counts alone do not establish speedups.
Correctness, preparation cost and operating boundaries
Earlier independent SDK probes with the same mechanism sources and 0047 firmware retain 18 VMs, 310 cases, 216 finals and 648 synchronous frames covering full-page writes, old lower fds, EOF, mmap, close and ATIME. Hash checks match 263 shared VM files, 18 Core files and 6 guest files. The combined 76 page/data/close/ATIME cases use NE1; the DATA-only 25 and FLUSH-only 11 use NE0, with those configuration scopes retained in the reuse review. SDK and ordinary CLI binaries differ; these cases do not constitute a new complete CLI semantic acceptance. The new CLI's 20 formal, 4 preflight and 4 counter environments pass their original output, Bundle, byte and source-contract checks.
Existing fstat and copy_file_range boundaries remain unresolved. True O_PATH uses raw openat/F_GETFL/EBADF hard assertions; the musl construction difference is diagnostic only. The 19 actual short-read function/caller C cases use primitive stubs, not full guest/kernel fault injection. Mutable, upper, multiple-hardlink, remote and other unqualified sources retain fallback. Negotiated snapshot capture/restore remains rejected, and prepared workspace remains a fresh-entry capability; see CLI prerequisites.
That cohort supported prioritizing ordinary CLI readonly-FLUSH coverage, now connected through scoped prepared-rootfs automatic requests. DATA benefits repeated small-file reads without a detected extra overall gain over FLUSH alone, and remains default-off. The generic VM worker still defaults FLUSH off; these results do not relax attribute TTL, enable WB or change the user-facing cross-runtime table. Timing summary, all comparisons and timing provenance retain 128 vectors and 160 intervals; per-tool counts, owner lifetimes and counter provenance retain independent N1 evidence. Raw reports, frozen-artifact associations and the reuse review remain local in benchmark/.data/cdf17-cli/.
Linux: the ordinary CLI sealed-workspace entry
With prepared rootfs in both arms, replacing the ordinary CLI live workspace with an authenticated fixed generation and frozen baseline reduced cumulative three-round seven-tool time from 4688.372 ms to 4443.913 ms: 5.21%, 95% CI [0.44%, 10.91%]. All five paired totals decreased; Ready detected no difference. Round 3 git fell by 73.74%, while Round 2 stream_write was 5.05% slower. Workspace ownership/cache eligibility and read-observation/journal baseline semantics change jointly. This gain cannot be added to or multiplied by the separate prepared-rootfs comparison's 18.11%.
Question and experiment design
After ordinary CLI rootfs ownership is connected, a live Mutable workspace still retains read observations and repeated lookups. This comparison tests whether an explicit sealed workspace further reduces tool time through actual pvisor run, Host service, stage/journal, VmExecutor, and native runner execution. Both arms use the same authenticated sealed physical rootfs and declare no execution-checkpoint support. This value is the Bundle executor_plan declaration; the actual native binding was not retained and is unknown. The control reads a freshly copied live lower; treatment reads a leased, fixed workspace-catalog generation while retaining an independent live apply target.
The public pvisor-cache prepare-workspace command prepares inputs once, outside formal clocks, in about 1.415 s. Later launches authenticate the retained generation without sealing it again. Fixed-generation reads exclude later host-project edits; ordinary apply still targets the live project and checks baseline conflicts for selected writes. Entry requirements and logical checkpoint fork/restore and execution checkpoint capture/restore restrictions are in the CLI and configuration reference. Preparation is reported separately from runtime gains.
On 2026-10-17, B-FS-ENG uses the same frozen GNU release CLI and 0047 firmware. The platform is Linux x86_64/KVM, with 2-vCPU/16-GiB guests and a CPU 0/1, two-core-quota, 16-GiB, swap 0 parent budget. Guest cache is 1 and directory-FD capacity is 256. WB, DAX, isolated lower DATA, readonly FLUSH elision, standard negative entries, both Core absence caches, and same-OPEN qualification reuse are all 0. Actual Immutable workspace eligibility can enable the existing directory image; isolated lower data caching is not enabled here.
Each arm has five fresh Host/VM environments and three resident rounds of nine operations, with seeded random order within five environment blocks. Every sample uses independent user/mount/PID namespaces, owned pivot_root, private Host authority, and actual CLI artifacts without reusing the user's existing Host. Ready runs from before CLI launch to the unique guest Ready, including fresh Host+VM startup; worker clocks retain the original task boundary. Both exclude exit. The stream_write task retains its own fsync/close. Formal timing disables profiling, startup diagnostics, and Rust logging. There are no warmups, quiet-period, interference, or full-inventory gates; every valid slow sample remains.
Formal duration
All 10/10 formal environments, 2/2 preflight environments, and 2/2 separate diagnostic environments passed. Formal evidence rechecks unique Ready/Result, normal CLI exit, terminal Job, matching VM Bundle run IDs, actual source arguments, and workspace receipts. All bytes of 256 written files and three stream files, lower isolation, and tool/Python cache checks pass. The primary metric sums three rounds of seven tools within each environment before taking the median across five environments. The 5000-resample paired bootstrap samples environment blocks; the rounds are not fifteen independent observations, and the 32 intervals are unadjusted for multiple comparisons.
Units are ms. Reduction is 100 × (1 − sealed/live); negative values mean slower. Displayed medians need not add up to the aggregate median.
| Metric | Live workspace | Sealed workspace | Reduction % | 95% CI % |
|---|---|---|---|---|
| Three-round seven-tool total, primary | 4688.372 | 4443.913 | 5.21 | [0.44, 10.91] |
| Ready, fresh Host+VM | 823.420 | 823.755 | -0.04 | [-0.41, 14.16] |
| Round 1 seven-tool sum | 2288.425 | 2171.404 | 5.11 | [2.66, 18.78] |
| Round 2 seven-tool sum | 1226.979 | 1158.533 | 5.58 | [-0.87, 16.26] |
| Round 3 seven-tool sum | 1131.460 | 1144.181 | -1.12 | [-5.06, 4.91] |
Round 1's sum shows an improvement signal; Rounds 2 and 3 detect no difference. The aggregate gain does not establish improvement in every round or tool.
| Selected operation | Live workspace | Sealed workspace | Reduction % | 95% CI % |
|---|---|---|---|---|
| metadata, Round 1 | 165.958 | 49.680 | 70.06 | [58.14, 72.35] |
| read, Round 1 | 109.257 | 77.354 | 29.20 | [28.35, 30.29] |
| git, Round 1 | 348.148 | 488.195 | -40.23 | [-45.83, 29.29] |
| git, Round 2 | 22.534 | 6.287 | 72.10 | [57.50, 76.64] |
| git, Round 3 | 25.534 | 6.706 | 73.74 | [68.06, 78.15] |
| rg, Round 1 | 381.784 | 310.505 | 18.67 | [15.95, 20.01] |
| rg, Round 2 | 332.679 | 306.725 | 7.80 | [6.68, 9.11] |
| rg, Round 3 | 330.227 | 305.918 | 7.36 | [7.13, 8.88] |
| stream_write, Round 2 | 398.455 | 418.566 | -5.05 | [-5.05, -1.67] |
Round 1 git has a slower point estimate with an interval crossing zero; npm detects no difference in any round, and Round 2 stream_write shows a regression signal. The duration summary and paired comparisons retain all 32 metrics at full precision.
The five paired aggregate observations, in pair order, are live [4640.929, 4976.164, 4688.372, 4461.678, 4722.226] and sealed [4545.601, 4433.041, 4443.913, 4442.037, 4511.719] ms. Every pair improves, but one decreases by only 19.641 ms; the aggregate median alone hides variation in magnitude.
The following separated observations are reported by proportion and within-group median, in ms. These groups describe five raw values without establishing stable modes or causes.
| Operation / condition | Lower group | Higher group |
|---|---|---|
| write, Round 2, live | 2/5, 89.075 | 3/5, 150.359 |
| write, Round 2, sealed | 3/5, 79.076 | 2/5, 152.137 |
| metadata, Round 3, live | 2/5, 96.377 | 3/5, 166.624 |
Live Ready includes 957.248 ms, with the other four at 820.363–831.455 ms. Live Round 1 git includes 690.396 ms, with the others at 340.424–359.138 ms. All slow values remain, without host-interference attribution, N5 tail-latency claims, or sample removal to narrow intervals.
Independent counters: less directory and read-observation work, retained OPEN/READ/FLUSH
Each arm has one separate N1 diagnostic VM, excluded from formal timing. Every VM has a unique final for each of 13 registered instances: Core 3, preimage-log 2, log-read 2, and two each of Overlay/protocol/dispatch. Every mount has 54 tokens and 27 complete operation phases, totaling 216 mounted component intervals. Both mounted owners verify actual directory capacity and disabled experimental preferences. Intervals include checked() child-process-tree startup, work, and original validation, a wider boundary than worker clocks.
The table counts workspace seven-tool phases, live→sealed. Core counts are the sum of parent and leaf software queries.
| Workspace count | Round 1 | Round 2 | Round 3 |
|---|---|---|---|
| LOOKUP | 3673 → 464 | 1918 → 405 | 2044 → 306 |
| GETATTR | 752 → 628 | 677 → 2658 | 646 → 2680 |
| Core queries | 156149 → 48314 | 89390 → 42224 | 90544 → 36969 |
| OPEN | 4497 → 4497 | 2681 → 2681 | 2681 → 2681 |
| READ | 4560 → 4560 | 2480 → 2480 | 2480 → 2480 |
| FLUSH | 4785 → 4785 | 2681 → 2681 | 2681 → 2681 |
| RELEASE | 4780 → 4780 | 2682 → 2682 | 2682 → 2682 |
LOOKUP and Core queries decrease substantially, while content reads and handle round trips remain. Metadata alone records GETATTR 80→2050 in Round 2 and 81→2050 in Round 3. Fewer positive lookups do not eliminate attribute revalidation. ATIME and other invalidation sources still need separate checks; the GETATTR increase cannot be attributed solely to TTL expiry.
Round 1 git records actual fingerprint_content spans 2055→1 and content-fingerprint bytes 2,261,307→0; the remaining sealed-arm span reuses the content index. The Round 1 seven-tool totals are 2156→1 and 69,375,691→0 bytes. A frozen baseline skips live-read preimage publication; mutations still retain baseline/conflict evidence, and index reuse retains metadata/xattr/identity checks. journal_log includes existing-record checks and promotion, so its call count is not a count of new durable writes. The local derived CSV core_fingerprint_calls column measures the non-compact generic fallback label; its zero value does not mean that compact paths perform no fingerprint work.
Both mounts have nonzero lifetime READINDEX, which may occur before the first tool phase; phase deltas do not cover the entire owner. Per-operation counters, owner totals, and counter provenance retain complete scope. These are software request/query counts, not disk I/O, and inclusive spans cannot be added to calculate their share of tool time.
Ordinary-CLI incremental coverage from isolated lower data pages and readonly FLUSH elision has been measured in the independent four-arm comparison. The causes of GETATTR and separated write observations still require same-batch controls and the existing copy-up, old-fd/mmap, alias and conflict oracles. This entry does not fix the existing shared-page boundary or WB unlink→syncfs problem, or justify enabling unmeasured combinations. Reusable preparation pays off according to actual launch frequency; its 1.415 s cost needs separate amortization. Provenance retains compact artifact/source/formal/diagnostic hash associations; complete raw records remain in local engineering evidence.
Linux: reusing qualification evidence within one OPEN
Reusing evidence from the same native FD reduced the four measured qualification-query attempts by 57.14%, but detected no improvement in the seven-tool aggregate or Ready; the candidate remains off by default. The median three-round seven-tool total was 3809.365→3644.779 ms, a duration-reduction estimate of 4.32% with 95% CI [-4.71%, 9.06%]. Fewer queries do not establish an overall speedup. This is separate from the ordinary CLI prepared-rootfs joint treatment; their gains are not combined.
Mechanism and experiment design
With isolated lower data objects and readonly FLUSH elision both enabled, an eligible OPEN previously ran two qualification paths: two F_GETFL, two fstat measurements for File::metadata call sites, one statx, and two fstatfs calls. The candidate passes complete statx, status-flag, and local-filesystem evidence for the same actual FD through the current call stack, leaving one F_GETFL, one statx, and one fstatfs. The 7→3 count covers only these four qualification-query categories, a 57.14% reduction; all four labels count instrumented call-site attempts without a syscall tracer. They establish neither the underlying ABI nor the full syscall count of OPEN.
Core resolution, authorization, aliases, journal observations, native OPEN, FD leases, the second backend check, and object-ID/fixed-EOF constraints remain. Evidence does not survive the OPEN, cache authorization or namespace conclusions, or add a wire capability, persistent handle field, or snapshot schema. SQ is a host preference; DATA and FLUSH still negotiate independently and retain fallback. The internal inclusive open span has different boundaries between arms, so it cannot be compared directly or added to other spans to infer elapsed time.
On 2026-10-17, B-FS-ENG uses the same frozen GNU host and existing 0047 firmware, differing only in the default-off PVISOR_VM_FS_SHARED_OPEN_QUALIFICATION=0|1. Both arms fix DATA=1, readonly FLUSH=1, negative entries=0, both Core absence caches=0, directory-FD capacity 256, WB=0, DAX=0, and guest cache=1. They reuse the same owned Immutable rootfs/workspace generations and frozen workspace baseline. Prior sealing is outside the clocks; inputs are not imported on every launch. The platform is Linux x86_64/KVM, with 2-vCPU/16-GiB guests under a CPU 0/1, two-core-quota, 16-GiB, swap 0 parent budget. The path retains PVisor, ManagedJob, stage/journal, VmExecutor, and the native runner, omitting the ordinary CLI Host service.
Each arm uses five fresh environments and three resident rounds of nine operations, with seeded random order within environment blocks. Formal profiling and Rust logging are off. Ready runs from launch to guest Ready; worker clocks retain their original task boundary. Both exclude exit. Checks retain normal exit, a unique completed receipt, the same Job Bundle, cache/lower isolation, all 256 written files, and all bytes of three stream files. There are no quiet-period, interference, or full-inventory gates, and no valid slow sample is deleted. The primary metric first sums all three rounds of seven tools within each environment, then compares the medians of five environments. The 5000-resample paired bootstrap samples environment blocks; rounds are dependent, and the 32 intervals are unadjusted for multiple comparisons.
Formal duration: no overall improvement established
All 10/10 environments were valid, with zero failures. The table shows medians over five environments per arm, in ms. Reduction is 100 × (1 − on/off); negative values mean slower. Round totals are computed within environments before medians, so displayed medians need not sum to the aggregate median.
| Metric | Off | On | Reduction % | 95% CI % |
|---|---|---|---|---|
| Three-round seven-tool total, primary | 3809.365 | 3644.779 | 4.32 | [-4.71, 9.06] |
| Ready | 636.570 | 630.220 | 1.00 | [-10.52, 17.08] |
| Round 1 seven-tool sum | 1843.590 | 1836.860 | 0.37 | [-9.82, 8.46] |
| Round 2 seven-tool sum | 1016.808 | 917.108 | 9.81 | [-1.87, 9.82] |
| Round 3 seven-tool sum | 948.748 | 922.674 | 2.75 | [-8.51, 9.42] |
Neither npm nor rg detected a difference in any round. The five paired aggregate values, in pair order, were off [3839.372, 3809.365, 3654.956, 3504.987, 3912.779] and on [3644.779, 3464.083, 3599.055, 3670.007, 3906.615] ms. Four pairs decreased and one increased by 165.020 ms; magnitudes varied. Round 1 git in the off arm included 227.544 ms, with the other values at 382.786–405.386 ms. Round 2 write ranged 77.930–154.502 ms and 77.935–156.292 ms; metadata ranged 76.061–145.899 ms and 75.564–137.783 ms. Every observation remains. N5 cannot establish stable clusters, tail latency, or causes; no host-interference attribution is made.
Only Round 2 stream_write showed an improvement signal among the 32 unadjusted intervals: 435.356→375.640 ms, a 13.72% reduction, 95% CI [0.65%, 15.22%]. Rounds 1 and 3 did not repeat it. The separate diagnostic found zero workspace qualification-query attempts in that phase, although rootfs still had child-startup queries. This single secondary signal therefore does not show that shared qualification directly accelerated writing. The duration summary and paired comparisons retain all 32 distributions and intervals.
Independent counters: duplicate classification removed, OPEN retained
Each arm has one separate N1 diagnostic environment. Every VM has a unique final for each of 17 registered instances: Core 4, preimage-log 3, log-read 4, and two each of Overlay/protocol/dispatch. Every mount has 54 tokens and 27 complete operation phases, totaling 216 mounted component intervals. Both mounted owners explicitly verify actual SQ 0 or 1, DATA/FLUSH 1, negative entries and both Core absence caches 0, and capacity 256. Counter intervals include checked() child-process-tree startup, tool work, and original validation, a wider boundary than worker time.
The table sums only the four qualification-query-attempt counters for each round's seven tools, off→on. F_GETFL, fstat, statx, and fstatfs attempts are added; the other five control-flow labels are not counted again.
| Scope | Round 1 | Round 2 | Round 3 |
|---|---|---|---|
| rootfs | 8400 → 3600 | 7364 → 3156 | 7364 → 3156 |
| workspace | 29554 → 12666 | 14973 → 6417 | 14973 → 6417 |
Both mounts reduce this count by 57.14% in every round. Over the complete owner lifetime, rootfs queries were 25760→11040 and workspace queries 59507→25503. The on arm recorded 3680 and 8501 shared attempts/receipt hits respectively, with zero legacy FLUSH/DATA classification attempts. The off arm had zero shared attempts/receipt hits; each legacy classification ran 3680 and 8501 times. Receipt hits include reused ineligible decisions, rather than necessarily issuing successful data-object IDs. These are neither guest cache hits nor disk I/O.
| Round 3 seven-tool scope | OPEN | READ | FLUSH | RELEASE | Core parent+leaf queries |
|---|---|---|---|---|---|
| rootfs | 1052 → 1052 | 0 → 0 | 0 → 0 | 1052 → 1052 | 21652 → 21652 |
| workspace | 2681 → 2681 | 277 → 277 | 542 → 542 | 2682 → 2682 | 36601 → 36597 |
Round 3 LOOKUP/GETATTR also remained 947/450 for rootfs and 306/2626 for workspace. OPEN, FLUSH, and RELEASE were unchanged in every round on both mounts. READ was not identical everywhere: rootfs Round 1 changed 1231→1236, with zero in the later rounds; workspace READ was unchanged in all rounds. The evidence establishes removal of duplicate qualification work, without measuring its share of tool time. Per-operation counters, the request summary, owner totals, and counter provenance retain all nine qualification labels and boundaries.
Correctness and coverage limits
Eighteen separate real guests passed 310 hard cases, 216 registered finals, and 648 synchronous checkpoints. Each SQ setting retained the 92-case, five-mode suite with NE enabled, plus 16 cases with NE off, 25 DATA-only cases, 11 FLUSH-only cases, and 11 applicable close/fallback cases on the old 0046 peer. Original whole-page, fixed-EOF, alias/copy-up, mmap, direct-I/O, raw O_PATH/EBADF, ATIME, negative-entry, exclusion, permission, concurrent-mutation, and close oracles remain.
Eligible cross-FD rounds retained OPEN/RELEASE [1,1,1] and READ [1,0,0]; combined qualification changed 7→3 and DATA-only 4→3. FLUSH-only and old-peer runs had actual DATA 0/FLUSH 1 and zero shared classification attempts. Mutable DATA/FLUSH/negative eligibility remained 0. Repeated ordinary absence used one LOOKUP with NE on and 32 with it off; Mutable and both exclusion intervals remained at 32, with zero negative replies, and expiry caused a new query. The hard-case list and probe provenance retain this scope. These are not VM checks of the ordinary CLI, remote backends, real snapshot restore, or unsupported-statx faults.
The candidate does not fix existing namespace-fd fstat and copy_file_range boundaries or the known unlink→syncfs ENOENT under writeback. WB was 0 here. This section does not support default enablement or extending the SDK result to the ordinary CLI or a complete Agent. The provenance summary publishes compact hash associations and a provenance summary of 499 frozen source files. Frozen artifacts, source files, complete reports, and every raw observation remain locally in benchmark/.data/sq17b/, benchmark/.data/sq17bm/, and benchmark/.data/sq17bp/.
Linux: the ordinary CLI prepared-rootfs entry
The real ordinary CLI prepared-rootfs entry reduces cumulative three-round seven-tool time from 5659.783 ms to 4634.557 ms in this configuration: 18.11%, 95% CI [2.00%, 31.90%]. Ready falls by 3.26%, 95% CI [2.55%, 13.46%]. Both cumulative time and Ready decrease in all five pairs. This jointly changes rootfs ownership/cache eligibility and checkpoint capability/admission, so the entire 18.11% cannot be attributed to cache. The result applies to explicit selection of previously trusted, sealed inputs, not arbitrary live rootfs directories or equivalent gains from the default CLI.
Question and experiment design
Once an engineering path qualifies for caching, users still need evidence from ordinary CLI execution with real Host startup, stage/journal and a live workspace. Both arms therefore run real pvisor run, differing only in rootfs source arguments: ordinary --rootfs PATH and --rootfs-base-store STORE --rootfs-base ID select the same sealed physical directory. The prepared entry authenticates and acquires its lease through public SnapshotStore APIs. A public API retains the persistent catalog pin; original sealing and one-time catalog preparation are outside the clocks. Inputs are not reimported at every launch, and this experiment does not measure first sealing or first registration latency.
On 2026-10-17, B-FS-ENG uses the same frozen GNU release CLI and 0047 firmware in both arms. Each workspace is a fresh live Mutable lower/apply target, without a workspace snapshot or frozen baseline. Guest cache=1, directory-FD capacity=256, WB=0 and DAX=0. The isolated-lower data-object protocol, read-only FLUSH elision, standard negative entries and both Core absence caches are all 0. Execution uses Linux x86_64/KVM, guest 2 vCPU/16 GiB and a parent budget of CPUs 0/1, two-core quota, 16 GiB and zero swap. Existing guest directory images and root-device page retention can qualify with genuine Immutable rootfs ownership; these differ from the new DATA protocol disabled here.
Complete byte checks for the fixed tool workload do not fix the existing root KEEP_CACHE lower/upper shared-page boundary. Old lower fd/mmap isolation after copy-up remains limited by that boundary. The new DATA protocol is disabled here, so entry-path timing does not establish complete file-object semantics.
Each arm has five fresh Host/VM environments, seeded random order within five paired blocks, and nine operations in three resident rounds per environment. Every sample has an independent user/mount/PID namespace, owned pivot_root, copied CLI, private /tmp Host authority and HOME/XDG. It neither reuses nor stops the user's existing Host. Ready runs from immediately before CLI launch to the unique guest Ready and includes symmetric fresh Host+VM startup; workers retain their task-internal clocks. Both exclude exit. Formal timing disables profiling, startup diagnostics and Rust logging. No warmup, quiet, interference or full-inventory gate is used; every valid slow observation remains.
Formal timing
All 10/10 formal environments are valid with zero failures. Real CLI processes exit normally, with unique Ready/Result, terminal Jobs, matching Job/Bundle run IDs, valid tool/Python caches, live-lower isolation and complete bytes in 256 written files and three stream files. Analysis rechecks frozen configuration/artifacts, randomized order and raw logs, rejecting filesystem profile/debug records in timing samples. The primary metric sums all three seven-tool rounds within each environment before medians. Bootstrap resamples paired environment blocks 5,000 times; rounds are dependent and 32 intervals are unadjusted for multiple comparisons. Units are ms; reduction is 100 × (1 − prepared/path). Row medians need not add to the cumulative median.
| Metric | Ordinary path | Prepared | Reduction % | 95% CI % |
|---|---|---|---|---|
| Cumulative three-round seven tools, primary | 5659.783 | 4634.557 | 18.11 | [2.00, 31.90] |
| Ready, fresh Host+VM | 863.692 | 835.578 | 3.26 | [2.55, 13.46] |
| Seven tools, round 1 | 2864.324 | 2247.333 | 21.54 | [-4.30, 41.32] |
| Seven tools, round 2 | 1431.477 | 1181.038 | 17.50 | [11.00, 30.70] |
| Seven tools, round 3 | 1351.539 | 1206.185 | 10.75 | [4.26, 18.49] |
Second- and third-round sums have improvement signals; no first-round aggregate difference is detected. The clearer individual signals follow. Complete comparisons retain the remaining metrics; an improved seven-tool aggregate does not mean every tool improves.
| Individual metric | Ordinary path | Prepared | Reduction % | 95% CI % |
|---|---|---|---|---|
| cargo, round 1 | 477.596 | 363.002 | 23.99 | [19.05, 43.30] |
| cargo, round 2 | 35.362 | 19.490 | 44.88 | [43.47, 58.12] |
| cargo, round 3 | 33.537 | 19.927 | 40.58 | [35.82, 46.17] |
| npm, round 1 | 905.754 | 781.599 | 13.71 | [12.14, 37.27] |
| npm, round 2 | 777.578 | 523.573 | 32.67 | [18.04, 35.21] |
| npm, round 3 | 699.517 | 517.478 | 26.02 | [18.27, 26.24] |
| rg, round 2 | 346.466 | 332.988 | 3.89 | [1.65, 15.52] |
| rg, round 3 | 340.846 | 331.029 | 2.88 | [2.44, 4.70] |
The five cumulative observations in pair order are path [5262.059, 5661.812, 5659.783, 5254.040, 6909.506] and prepared [4400.809, 4634.557, 4571.396, 5148.752, 4705.643] ms. All remain; one pair saves only 105.287 ms, so the median must not hide variation in effect size. Path Ready has one 962.967 ms observation versus 857.432–870.931 ms for the others. First-round git has separated observations in both arms, ranging from 345.917–1007.694 ms path and 332.105–679.683 ms prepared. Third-round write and metadata instead have higher prepared medians, with intervals crossing zero. N5 cannot establish stable clusters, tail latency or causes; no host-interference attribution or removal of slow values is used to narrow intervals.
Independent counters and attribution limits
Each arm has another N1 diagnostic environment, excluded from formal timing. Inventory derived from the frozen real CLI construction is complete, with 13 registered instances and one final each: three Cores, two preimage logs, two log readers and two each of Overlay/protocol/dispatch. These cover Host stage/journal, both VM mounts, workspace journal and preparation/Bundle reads. Each mount has 54 tokens and 27 operations, totaling 216 mounted-component intervals. Every mounted capacity reports 256 and the new experimental settings report 0. Intervals include checked-subprocess startup, work and original validation, broader than worker clocks.
The following seven-tool request counts use path→prepared arrows. Core sums parent and leaf queries. Once rootfs qualifies, second- and third-round READ reach zero while ordinary OPEN and FLUSH remain.
| Rootfs count | Round 1 | Round 2 | Round 3 |
|---|---|---|---|
| READINDEX | 0 → 125 | 0 → 21 | 0 → 0 |
| OPEN | 1200 → 1200 | 1052 → 1052 | 1052 → 1052 |
| READ | 2339 → 1234 | 1475 → 0 | 1475 → 0 |
| LOOKUP | 4307 → 1474 | 3791 → 966 | 3794 → 947 |
| GETATTR | 518 → 253 | 455 → 456 | 453 → 454 |
| FLUSH | 1160 → 1160 | 1028 → 1028 | 1028 → 1028 |
| Core queries | 110969 → 38607 | 101564 → 22015 | 101568 → 21660 |
Third-round rootfs npm changes READ 891→0, LOOKUP 2943→934 and Core 85315→20012, while GETATTR changes 211→383. Cargo changes READ 147→0, LOOKUP 189→4 and Core 3198→330. Metadata calls do not uniformly fall. Global Core query differences are not native OPEN qualification costs or exact fractions of tool time.
| Live workspace count | Round 1 | Round 2 | Round 3 |
|---|---|---|---|
| READINDEX | 1 → 1 | 0 → 0 | 0 → 0 |
| OPEN | 4497 → 4497 | 2681 → 2681 | 2681 → 2681 |
| READ | 4560 → 4560 | 2480 → 2480 | 2480 → 2480 |
| LOOKUP | 3673 → 3621 | 1917 → 2167 | 2122 → 1927 |
| GETATTR | 748 → 755 | 679 → 679 | 650 → 650 |
| FLUSH | 4785 → 4785 | 2681 → 2681 | 2681 → 2681 |
| Core queries | 156125 → 155551 | 89391 → 92646 | 91577 → 89088 |
Workspace OPEN, READ and FLUSH remain identical. LOOKUP and Core counts change in both directions, including increases in round 2. Both arms fingerprint 69,375,691 workspace bytes in round 1 and zero in the next two. There is no frozen-baseline or workspace-data-cache treatment. Software queries are not disk I/O, and inclusive spans are not added to infer worker time. Per-tool counters and counter provenance retain all phases and actual settings.
The joint treatment also changes checkpoint admission. Bundle executor_plan.supports_checkpoint declares path=true and prepared=false; this is a plan declaration, not an observation of a successful checkpoint. Persisted control-socket/pool configuration is retained. The private temporary RunnerSpec native binding is unobserved; frozen source only establishes that prepared selection skips binding and a normal no-network path may bind when drivers provide a store. The ordinary arm's capabilities were not disabled for comparison. Ready cannot be attributed to cache alone, nor does this establish a full-tree snapshot audit on every ordinary launch.
This result supports further work on ordinary CLI prepared-rootfs selection with explicit ownership. It does not support marking live directories Immutable, automatically enabling unmeasured new protocols, or adding/multiplying gains across cohorts. Sealing preparation and the unmeasured first-import clock require separate product consideration. Timing summary, complete comparisons and provenance retain five pairs, 32 intervals and frozen-evidence associations. Raw timing, independent counters, preparation and artifacts remain locally in benchmark/.data/pc17b/.
Linux: standard negative-entry caching
Standard negative-entry caching changes cumulative three-round seven-tool time from 3725.942 ms to 3602.273 ms, a 3.32% reduction, 95% CI [-2.83%, 4.09%]. No overall gain is detected. Third-round npm has a 13.08% improvement signal, and the candidate remains disabled by default. Independent diagnostics reduce cumulative rootfs LOOKUP by 40.26%, with smaller workspace changes. The mechanism covers repeated absent-name requests without establishing a Ready or aggregate-task speedup.
The question is whether standard FUSE negative entries can further shorten ordinary tools on the owned-input path with isolated lower data pages and read-only FLUSH elision already enabled. Fewer software queries establish request coverage, not a timing benefit.
Mechanism and experiment scope
One frozen GNU host and the existing 0047 firmware vary only the default-off PVISOR_VM_FS_NEGATIVE_ENTRY_CACHE=0|1 preference. Both arms fix DATA=1, read-only FLUSH=1, directory-FD capacity 256, both Core absence caches=0, WB=0, DAX=0 and guest cache=1. They reuse the same owned Immutable rootfs/workspace generations and frozen workspace baseline. Linux x86_64/KVM, guest 2 vCPU/16 GiB, and normal PVisor, ManagedJob, stage/journal, VmExecutor and native-runner execution are retained; the CLI Host service is omitted. Previously sealed input preparation is outside Ready and tool clocks, without importing again at every launch.
Only successful merged absence after Core namespace, policy, alias and required absence-observation checks returns a standard successful Entry with nodeid=0, entry TTL one second and attribute TTL zero. No inode is allocated. Core exclusion ENOENT remains an error. Ancestors, the exact path and descendants of exclusions and synthetic names retain ordinary lookup; component siblings can qualify independently. Rootfs host-authority exclusions therefore preserve visibility protection without disabling unrelated names. Positive-entry and attribute TTLs remain unchanged. Mutable lowers, nondefault authorization rules, remote/unknown backends and WB/DAX retain fallback. Explicit eligibility also requires exclusive, stable ownership of upper namespace, directory permissions, physical roots, ancestors and mount identities throughout the owner lifetime. Negative-entry eligibility and lower-data-page eligibility are checked separately. This preference adds no wire capability; existing DATA/FLUSH negotiation and snapshot restrictions remain.
The formal design has five fresh environments per arm, nine operations in three resident rounds, with seeded random order within paired environment blocks. Ready measures launch to guest Ready; worker clocks measure tasks; both exclude exit. Formal timing disables profiling. Original output, cache, Bundle, lower-isolation, all 256 written-file bytes and all three stream files are checked, retaining every valid slow observation without quiet, interference or full-inventory gates. The primary metric sums all three seven-tool rounds within each environment before taking medians across five environments. Bootstrap resamples paired environment indexes 5,000 times; rounds are dependent, 32 metric intervals are unadjusted for multiple comparisons, and historical cohorts are not pooled.
Formal timing
All 10/10 formal environments are valid with zero failures. Normal exit, a unique completed receipt, the same-Job Bundle, and all written/stream-file bytes pass the retained-evidence audit. The table reports five-environment medians per arm in ms. Reduction is 100 × (1 − on/off); negative means slower. Round and cumulative sums are formed within environments before medians, so row medians need not add to the cumulative median.
| Metric | Off | On | Reduction % | 95% CI % |
|---|---|---|---|---|
| Cumulative three-round seven tools, primary | 3725.942 | 3602.273 | 3.32 | [-2.83, 4.09] |
| Ready | 626.342 | 628.624 | -0.36 | [-1.36, 8.32] |
| Seven tools, round 1 | 1855.661 | 1830.526 | 1.35 | [-1.38, 6.52] |
| Seven tools, round 2 | 930.908 | 940.753 | -1.06 | [-11.31, 6.91] |
| Seven tools, round 3 | 895.260 | 857.833 | 4.18 | [-4.95, 14.56] |
| npm, round 3 | 470.086 | 408.606 | 13.08 | [5.95, 20.50] |
The primary metric, Ready and each round's seven-tool sum all have intervals crossing zero. Third-round npm decreases in all five paired observations, but remains a secondary signal without multiple-comparison correction. First- and second-round npm and all three rg rounds have no detected difference. Among 32 metrics, second-round stream_write also has an 8.58% signal, 95% CI [0.10%, 15.02%]; this does not establish a write-path improvement. Paired comparisons retain every distribution and interval.
The five cumulative observations range from 3595.534–3755.754 ms off and 3576.400–3697.274 ms on, with overlap. Write observations are dispersed: round 2 ranges from 78.188–154.617 ms off and 78.542–154.637 ms on; round 3 ranges from 78.335–141.832 ms off and 77.793–154.746 ms on. Second-round metadata also spans 75.493–148.861 ms and 90.182–138.570 ms. All these valid observations remain. N5 cannot establish stable clusters or their causes; no host-interference attribution or removal of slow values is used to narrow intervals.
Independent counters: reductions concentrate in rootfs npm lookups
B-FS-DIAG uses one separate fresh environment per arm. Each VM has one final for every one of 17 registered instances, complete 54 tokens and 27 operation intervals per mount, and 216 mounted-component intervals. Both mounted Overlays report actual enabled=0 in the off arm and enabled=1 in the on arm. DATA/FLUSH each report 1, both Core absence caches report 0, and each mounted capacity reports 256. These actual settings are measured in the two independent diagnostic VMs, not per-owner counters from the ten profile-off timing VMs.
The following N1 counts use off→on arrows. Core queries sum parent and leaf stats. Intervals include checked-subprocess-tree startup, tool work and original validation, a broader boundary than worker clocks.
| Rootfs scope | LOOKUP | GETATTR | Core queries |
|---|---|---|---|
| npm round 1 | 1335 → 883 | 115 → 116 | 33347 → 27199 |
| npm round 2 | 952 → 533 | 395 → 396 | 20417 → 14843 |
| npm round 3 | 935 → 514 | 384 → 396 | 20013 → 14466 |
| Seven tools, round 1 | 1436 → 939 | 248 → 249 | 38051 → 31515 |
| Seven tools, round 2 | 965 → 540 | 450 → 451 | 22006 → 16391 |
| Seven tools, round 3 | 947 → 521 | 438 → 451 | 21601 → 16014 |
| Seven tools, all three rounds | 3348 → 2000 | 1136 → 1151 | 81658 → 63920 |
Third-round rootfs npm LOOKUP falls by 45.03% and Core queries by 27.72%; the corresponding seven-tool reductions are 44.98% and 25.86%. GETATTR does not fall alongside LOOKUP: its cumulative seven-tool count increases by 15. Metadata work remains.
| Workspace scope | LOOKUP | GETATTR | Core queries |
|---|---|---|---|
| Seven tools, round 1 | 463 → 448 | 622 → 617 | 48267 → 48095 |
| Seven tools, round 2 | 419 → 380 | 2628 → 2629 | 42104 → 41663 |
| Seven tools, round 3 | 307 → 306 | 2629 → 2628 | 36617 → 36609 |
| Seven tools, all three rounds | 1189 → 1134 | 5879 → 5874 | 126988 → 126367 |
Cumulative workspace LOOKUP falls by 4.63% and Core queries by 0.49%. npm LOOKUP across its rounds is 138→137, 127→87 and 15→13; Core queries are 2794→2764, 7336→6895 and 1849→1840. This counter comparison saves far fewer workspace queries than rootfs queries.
The following per-round requests are identical in both arms. Arrays list rounds 1/2/3 and cover only seven-tool phases:
| Scope | OPEN | READ | FLUSH | RELEASE |
|---|---|---|---|---|
| Rootfs | 1200 / 1052 / 1052 | 1231 / 0 / 0 | 0 / 0 / 0 | 1200 / 1052 / 1052 |
| Workspace | 4497 / 2681 / 2681 | 2494 / 277 / 277 | 563 / 542 / 542 | 4780 / 2682 / 2682 |
The enabled owners issue 1041 rootfs and 420 workspace negative replies over their complete lifetimes; seven-tool phases contain 974 and 418 respectively. Remaining replies belong to other operations or startup/exit boundaries. These count host decisions to return standard negative entries, not guest cache hits or all ENOENTs. Global physical Core queries are not native OPEN qualification counts, disk I/O or fractions of execution time. Inclusive spans are not added to infer worker time. Per-tool counters and counter provenance retain boundaries and actual qualification.
Correctness and product coverage
All 184 hard cases pass across ten independent real-guest VMs in both arms, with one final each for 120 registered instances and 612 complete synchronous tokens. Each arm retains 14 existing negative-entry cases and adds two cases for an existing excluded descendant and a missing exclusion ancestor. The original 4 whole-page, 25 data, 11 close and 36 ATIME oracles remain. Repeated ordinary stable absence changes from 32 LOOKUP to one; Mutable and both protected intervals retain 32→32, with protected negative replies 0→0. TTL expiry triggers a new query. Create/link/rename/unlink, failed mutations, permissions and concurrent visibility remain checked. Existing fstat and copy_file_range boundaries are unresolved.
Ordinary CLI prepared-rootfs integration separately passes one positive real-VM smoke test of configuration, persisted selector, exit and live-workspace/stage isolation. That test uses a Mutable workspace with DATA, FLUSH and negative entries disabled, and has zero performance samples. That smoke test measures neither Ready nor tool speedups. Independent ordinary CLI timing measures the joint entry treatment with these new mechanisms disabled; the enabled DATA/FLUSH/negative-entry combination still has no formal ordinary CLI performance samples. The CLI verification summary retains that scope. This engineering entry does not update ordinary CLI user tables, add or multiply gains from historical cohorts, or justify enabling the preference by default. Timing summary, paired comparisons and provenance retain the formal result and scope. Raw timing, independent counters and frozen/probe evidence remain locally in benchmark/.data/nf17m/, benchmark/.data/nf17p/ and benchmark/.data/nf17/ respectively.
Linux: same-batch data-cache and local-FLUSH four-arm comparison
The three primary cumulative seven-tool contrasts—both versus neither, FLUSH alone and data alone—all have intervals crossing zero, with no detected overall difference. rg has improvement signals of 36.46%, 35.87% and 35.85% against neither across the three rounds, with gains over either single mechanism too. Ready has no detected difference. git and write have clearly separated observations, and cumulative time includes valid slow samples. These results establish no stable overall speed level; both defaults were off in that SDK entry. DATA remains default-off; the scoped prepared-rootfs entry now has automatic readonly-FLUSH requests.
Same-batch conditions and per-environment distributions
On 2026-10-17, B-FS-ENG forms four complete combinations of PVISOR_VM_FS_LOWER_DATA_CACHE and PVISOR_VM_FS_READONLY_FLUSH_ELISION: neither (0, 0), data only (1, 0), FLUSH only (0, 1) and both (1, 1). Product host, 0047 firmware and guest hashes match the independent data-page experiment below exactly, with no product-code changes. The experiment harness adds strict four-combination declarations and verification. Both absence caches are off, directory-FD capacity is 256, WB=0, DAX=0 and guest cache=1. All arms share the same owned Immutable rootfs/workspace and frozen baseline. Linux x86_64/KVM, guest 2 vCPU / 16 GiB, normal PVisor, ManagedJob, stage/journal, VmExecutor and native-runner paths remain, with the CLI Host service omitted. Sealing preparation is outside the clocks; formal timing disables profiling.
Each arm has five fresh VMs, randomized within five paired environment blocks using a fixed seed, with nine operations in three resident rounds and no warmups. All 20 formal environments pass output, tool-cache inheritance, normal exit, a unique completion receipt, matching Run Bundle, lower isolation and every written/stream byte, with zero failures. There is no quiet, interference or full-inventory gate; all valid slow samples remain. Ready measures usable output only, excluding tools and exit. Worker clocks exclude launch and exit; stream_write retains its own fsync/close. Rounds are dependent, leaving five independent environments per arm. The cumulative metric first sums 21 seven-tool worker clocks within each environment; it is not complete-task wall time.
The following raw values are easily hidden by a single median. Units are milliseconds; each cell follows the same five paired-block positions, without sorting or removing samples.
| Arm | Five three-round seven-tool totals | Five round 1 git values | Five round 2 write values |
|---|---|---|---|
| Neither | 4194.020, 4053.891, 4381.354, 4166.841, 4194.600 | 483.359, 478.957, 481.103, 473.820, 409.048 | 78.694, 78.204, 144.111, 78.653, 78.265 |
| Data only | 3900.397, 4282.989, 4140.359, 3906.282, 4180.700 | 500.143, 497.963, 488.727, 490.670, 494.632 | 78.744, 154.757, 78.521, 79.988, 142.362 |
| FLUSH only | 3893.136, 3949.882, 3806.316, 4011.330, 3989.992 | 393.816, 388.706, 237.472, 394.793, 395.724 | 135.390, 78.518, 156.306, 155.250, 79.216 |
| Both | 4240.425, 3709.847, 3743.222, 3623.802, 3826.109 | 407.036, 402.128, 387.853, 219.856, 404.665 | 144.888, 141.439, 78.563, 154.812, 148.075 |
Round 2 write has lower/higher observations separated by gaps. The four arms have 4, 3, 2 and 1 lower values around 78–80 ms; remaining higher values are around 135–156 ms. This description is post hoc, not preregistered clustering; N=5 cannot establish stable clusters or tail latency. A single median supplies no write-speedup or regression conclusion. Round 1 git in FLUSH-only and both has four values around 388–407 ms and one lower value of 237.472 / 219.856 ms, producing wide intervals. Round 2 metadata in neither/data-only also has separated observations around 75–83 and 123–144 ms. These patterns are not attributed to host interference or a specific mechanism.
The data-only cumulative totals include two values at 3900–3906 ms and three at 4140–4283 ms; both-enabled has four at 3624–3826 ms and one at 4240.425 ms. These describe observed gaps, without establishing persistent modes. One valid both-enabled environment also contains round 2 npm at 742.262 ms and round 3 read at 85.993 ms; its other four read values are 27.170–27.281 ms. All slow values enter the bootstrap. Full statistics retain every environment for all 32 metrics; the cumulative single-median projection supplies no stable overall ranking.
Preregistered contrasts and local tool signals
The three primary contrasts are neither→both, FLUSH-only→both and data-only→both. Neither→each single mechanism supplies two supplementary contrasts, giving five pairs with 32 metrics each. The table projects the preregistered cumulative median reduction; positive means faster. The 95% CIs use 5,000 paired-bootstrap resamples over five environment blocks and must be read with the full distributions above.
| Contrast | Role | Three-round reduction % | 95% CI % | Conclusion |
|---|---|---|---|---|
| Neither→both | Primary | 10.75 | [-1.11, 14.56] | No detected difference |
| FLUSH only→both | Primary | 5.23 | [-8.92, 9.66] | No detected difference |
| Data only→both | Primary | 9.59 | [-8.72, 13.38] | No detected difference |
| Neither→data only | Supplementary | 1.28 | [-5.65, 7.00] | No detected difference |
| Neither→FLUSH only | Supplementary | 5.82 | [2.57, 13.12] | Improvement signal |
The supplementary signal does not replace the three primary cumulative intervals crossing zero. rg reductions and 95% CIs by round follow, in percent.
| rg round | Neither→both | FLUSH only→both | Data only→both |
|---|---|---|---|
| 1 | 36.46 [35.10, 37.78] | 23.64 [20.97, 25.84] | 22.15 [18.74, 25.42] |
| 2 | 35.87 [34.61, 36.85] | 23.11 [22.19, 26.92] | 21.01 [18.86, 23.25] |
| 3 | 35.85 [31.00, 36.76] | 22.62 [17.07, 24.30] | 22.04 [15.72, 29.38] |
Round 1 git has a 16.04% signal for both versus neither, CI [1.07%, 53.60%], and 18.70% versus data-only, CI [18.19%, 55.19%]. Versus FLUSH-only it has no detected difference: reduction -2.11%, CI [-63.33%, 44.31%]. Data-only versus neither has a 3.27% round 1 git regression signal, reduction CI [-20.92%, -1.58%]. These intervals require the separated git observations; a point estimate supplies no stable git speed level. Both-enabled round 2 read versus neither has a 14.98% signal, CI [11.82%, 15.21%]. Round 3 retains the slow value and has CI [-167.40%, 15.42%], with no detected difference; the round 2 result cannot be extended to it.
Ready has no detected difference in any of the five contrasts. All 160 paired comparisons and provenance retain every metric and the method. The 160 individual intervals have no multiple-comparison adjustment; metrics, rounds and contrasts are dependent. There is no comparison between the two single mechanisms or test of an interaction term. These signals establish neither comprehensive seven-tool improvement nor a sum of data/FLUSH percentages from earlier cohorts.
Independent request counts and combined correctness
B-FS-DIAG uses one separate fresh environment per arm, excluded from formal timing. Each arm has exactly one final for all 17 registered instances. All 54 tokens are complete on both rootfs/workspace devices, giving 216 phase-component intervals. Each mounted owner verifies both actual data/FLUSH settings against its combination, capacity 256 and both Core caches 0. Intervals include the checked() subprocess tree's startup, tool work and original validation, exceeding the worker-clock boundary. The table contains round 3 counts, N=1 per arm.
| Scope / request | Neither | Data only | FLUSH only | Both |
|---|---|---|---|---|
| Rootfs seven-tool READ | 0 | 0 | 0 | 0 |
| Rootfs seven-tool FLUSH | 1028 | 1028 | 0 | 0 |
| Rootfs seven-tool OPEN / RELEASE | 1052 / 1052 | 1052 / 1052 | 1052 / 1052 | 1052 / 1052 |
| Workspace seven-tool READ | 2480 | 277 | 2480 | 277 |
| Workspace seven-tool FLUSH | 2681 | 2681 | 542 | 542 |
| Workspace seven-tool OPEN / RELEASE | 2681 / 2682 | 2681 / 2682 | 2681 / 2682 | 2681 / 2682 |
| Workspace rg READ / FLUSH | 2051 / 2051 | 1 / 2051 | 2051 / 1 | 1 / 1 |
| Workspace rg OPEN / RELEASE | 2051 / 2051 | 2051 / 2051 | 2051 / 2051 | 2051 / 2051 |
| Workspace rg data flags / FLUSH flags | 0 / 0 | 2050 / 0 | 0 / 2050 | 2050 / 2050 |
The mechanisms remove READ and FLUSH respectively, and both savings remain when combined. OPEN/RELEASE do not decrease. Combined rg reuses 2050 object IDs, and all owners have zero object-capacity rejections. Per-tool counters and counter provenance retain every round and complete coverage. Native fstat, F_GETFL, statx and fstatfs qualification calls have no separate counters. OPEN flags and object-ID reuses do not count those syscalls; Core queries also omit part of qualification work. Inclusive spans are not added to exactly attribute git changes or infer proportional worker gains.
Independent real-guest tests with both capabilities enabled pass all 76 cases: 4 original whole-page, 25 data, 11 close and 36 ATIME. All 48 registered instances across four VMs have a unique final, with 296 complete synchronous tokens. Combined probes, probe provenance and synchronous phases retain the original byte, EOF, close and ATIME oracles, with no formal performance samples. True O_PATH still uses raw openat/F_GETFL/EBADF hard assertions; the musl Rust constructor difference is diagnostic only. The existing fstat/copy_file_range boundaries remain unresolved. Negotiated snapshot capture/restore is still rejected, that cohort did not cover ordinary CLI owned-input integration, and its generic SDK defaults remained 0. Subsequent ordinary CLI four-arm timing covers the enabled DATA/FLUSH combination, without extending complete semantic acceptance. The separate ordinary CLI comparison covers the sealed-rootfs entry with both new mechanisms disabled. Raw timing, counters and frozen evidence are separately retained in benchmark/.data/df17m/, benchmark/.data/df17p/ and benchmark/.data/df17/, independently of earlier experiments.
Linux: isolated data-page caching for Immutable lowers
Cumulative three-round seven-tool time changes from 4251.227 ms to 4052.522 ms, a 4.67% reduction, 95% CI [-0.20%, 7.40%]. No overall gain is detected. rg has improvement signals of 17.54%, 17.40% and 17.73% across the three rounds, and the candidate remains disabled by default. Second- and third-round read improve by 12.47% and 13.30%; first-round git instead has a 2.79% regression signal. Ready has no detected difference. Independent guest probes support lower/upper data-page and fixed-EOF isolation within their exercised scope; complete file-object semantics remain unresolved, and ordinary CLI user tables are unchanged.
Conditions and formal timing
On 2026-10-17, B-FS-ENG uses the same frozen GNU host and 0047 firmware, varying only PVISOR_VM_FS_LOWER_DATA_CACHE=0|1. Both arms reuse owned Immutable rootfs/workspace inputs and a frozen baseline. Directory-FD capacity is 256, WB=0, DAX=0 and guest cache=1; lower negative caching, upper absence caching and read-only FLUSH elision are all disabled. Linux x86_64/KVM, guest 2 vCPU/16 GiB, normal PVisor, ManagedJob, stage/journal, VmExecutor and native-runner paths are retained, with the CLI Host service omitted. Previously sealed input preparation is outside the clocks, and formal timing disables profiling.
Each arm has five fresh VMs, randomized within seeded paired blocks, with nine operations in three resident rounds and no warmups. All ten formal environments pass normal exit, output, tool-cache inheritance, Run Bundle, lower isolation, every written file and all stream-byte checks, with zero failures. There is no quiet, interference or full-inventory gate; all valid slow samples remain. Ready excludes tools and exit; worker clocks exclude launch and exit, while stream_write retains its own fsync/close. Resident rounds are dependent, leaving five independent environments per arm. The cumulative metric sums 21 seven-tool worker clocks within each environment before taking the median; it is not complete-task wall time.
Values below are median milliseconds; positive reduction means faster and negative means regression. The 95% CIs use 5,000 paired-bootstrap resamples over five environment blocks.
| Metric | Disabled | Enabled | Reduction % | 95% CI % |
|---|---|---|---|---|
| Ready | 630.046 | 631.095 | -0.17 | [-2.30, 2.08] |
| Three-round seven-tool total | 4251.227 | 4052.522 | 4.67 | [-0.20, 7.40] |
| Round 1 seven-tool sum | 2087.586 | 2057.554 | 1.44 | [-2.87, 3.90] |
| Round 2 seven-tool sum | 1107.654 | 1055.036 | 4.75 | [-0.28, 12.00] |
| Round 3 seven-tool sum | 1114.969 | 973.086 | 12.73 | [-12.29, 16.34] |
| Round 1 rg | 304.234 | 250.860 | 17.54 | [16.27, 18.40] |
| Round 2 rg | 298.140 | 246.262 | 17.40 | [15.65, 30.67] |
| Round 3 rg | 299.072 | 246.034 | 17.73 | [14.40, 20.92] |
| Round 2 read | 31.112 | 27.234 | 12.47 | [12.05, 15.26] |
| Round 3 read | 31.378 | 27.203 | 13.30 | [12.05, 17.16] |
| Round 1 git | 481.001 | 494.406 | -2.79 | [-4.38, -2.16] |
| Round 1 hot_open | 10.186 | 10.321 | -1.32 | [-2.58, -1.16] |
Full statistics, 32 paired comparisons and provenance retain per-environment values and full precision. The three per-round sums and cumulative total all have no detected difference, as do write, metadata and npm in every round. First-round hot_open has another regression signal. Individual intervals have no multiple-comparison adjustment; rounds and aggregate metrics are dependent, and N=5 supports neither tail-latency claims nor a comprehensive no-regression guarantee. The local rg gain, other candidates' percentages and absolute times across cohorts cannot be added into an overall gain.
Actual negotiation, request changes and remaining costs
Independent B-FS-DIAG has one fresh environment per arm, both valid. Each has a unique final record for all 17 registered instances, with complete rootfs/workspace coverage of 216 phase-component intervals and 54 synchronous tokens. Each mount verifies capacity 256 and its arm's actual data setting of 0/1; the other three experimental switches are disabled. The enabled counter records successful negotiation during an owner's lifetime; these are single-session fresh VMs. Intervals include the checked() subprocess tree's startup, tool work and original validation, exceeding the worker-clock scope. Diagnostic times supply no formal performance samples.
The table contains third-round request counts, N=1 per arm. Seven-tool totals sum only their seven phases; Core queries add parent-stat and leaf-stat units.
| Scope / request or flag | Disabled | Enabled |
|---|---|---|
| Rootfs seven-tool READ | 0 | 0 |
| Rootfs seven-tool OPEN / FLUSH / RELEASE | 1052 / 1028 / 1052 | 1052 / 1028 / 1052 |
| Rootfs seven-tool Core physical queries | 21653 | 21652 |
| Workspace seven-tool READ | 2480 | 277 |
| Workspace seven-tool OPEN / FLUSH / RELEASE | 2681 / 2681 / 2682 | 2681 / 2681 / 2682 |
| Workspace seven-tool Core physical queries | 37346 | 36590 |
| Workspace rg READ | 2051 | 1 |
| Workspace rg OPEN / FLUSH / RELEASE | 2051 / 2051 / 2051 | 2051 / 2051 / 2051 |
| Workspace rg qualified OPEN flags / object-ID reuses | 0 / 0 | 2050 / 2050 |
Third-round workspace seven-tool READ falls by 88.83%. rg READ changes from 2051 to 2, 1 and 1 across the three rounds. Its first-round flags include 2049 ID reuses, showing reuse of registered objects within a round as well; cross-round warming alone does not explain all of the change. Mounted owners have zero object-capacity rejections. The mechanism removes data-read round trips while normal OPEN, FLUSH, RELEASE and Core paths retain costs; read-only FLUSH elision is disabled in this comparison. Per-tool counters and counter provenance preserve each round and complete-lifetime scopes.
Lower Core query counts do not establish lower total host-query costs: qualified OPENs additionally check native fstat, F_GETFL, complete statx identity and fstatfs, outside Core parent/leaf units. Per-OPEN qualification is a cost hypothesis worth isolating next; these counters cannot exactly attribute the first-round git regression to it. Inclusive spans are not added or converted into worker-time shares, and N1 request counts do not establish proportional tool speedups.
Object ownership, real-guest evidence and remaining boundaries
After explicit INIT bit 44 and OPEN bit 28 negotiation, qualified OPEN uses a fixed 24-byte reply carrying a stable object ID and the physical lower's fixed size. The guest uses a distinct data inode/mapping for that object, reusing pages across independently closed/reopened lower fds while keeping upper copy-up writes and truncation out of the old lower pages and EOF. Normal Core resolution, permission checks, policy, baseline observations, native OPEN and each fd's FH/RELEASE remain. Eligibility requires an explicitly Immutable lower, a pinned read-only local native FD, a regular file with nlink=1 and the other qualification checks. Upper, Mutable, multiply linked and unsupported sources fall back. Each owner has at most 4096 IDs, whose assigned meanings are not recycled. Owners that negotiated the capability currently reject snapshot capture/restore; the default switch remains 0. The separate ordinary CLI sealed-rootfs comparison keeps this capability disabled; ordinary CLI performance with it enabled was unmeasured in that cohort and has since been measured in the independent four-arm comparison.
The enabled real-guest arm passes review-data, original review-pages, review-flush and atime at 25/25, 4/4, 11/11 and 36/36 respectively. The disabled arm retains 17 data failures and 4 original whole-page failures; the other two modes pass. These are case outcomes, not 21 independent product defects. Exercised paths include bound/unbound lowers, full/partial-page writes, truncation/extension, fixed EOF/SEEK_END, mmap/COW, mappings after close, rename/unlink, sendfile/splice, toggled O_DIRECT and fallback paths. Three independent cross-fd open/read/close rounds change READ from [1,1,1] to [1,0,0], while both arms retain OPEN/RELEASE [1,1,1], establishing reuse after actual closes. Old read-only MAP_SHARED msync(MS_SYNC) succeeds in both arms after fd close and upper copy-up. This covers the read-only mapping's call without extending writable shared-mapping synchronization guarantees.
The O_PATH hard oracle uses verified raw openat: both arms retain O_PATH in F_GETFL, and raw pread returns -1/EBADF. The original Rust OpenOptions::custom_flags(O_PATH) removes the bit because this musl target's O_ACCMODE includes O_PATH, yielding an ordinary read-only fd. Its readable result remains a construction diagnostic. Correcting fd construction retains both true O_PATH and EBADF requirements without weakening the semantic assertion; the first three attempts retain their emitted failures and provenance. All 96 registered instances across the final eight VMs have exactly one final record, with complete 592-token/296-interval coverage. Real-guest probes, probe provenance and synchronous phases retain the evidence; probe elapsed values are not performance samples.
Independent compatibility diagnostics use three fresh VMs. The new host with old 0046 firmware passes all 11 review-flush cases, retaining the four original review-pages baseline failures. Its data counters explicitly report requested=1, enabled=0 and no object flags. The old host with new 0047 firmware passes all 11 review-flush cases. Both directions have identical FLUSH-probe results and protocol call counts. All 36 registered instances across the three runs have exactly one final record. The old host lacks the new data counters: JSON retains NULL and CSV leaves them blank, without treating their absence as an actual setting of zero. Its fallback conclusion uses the frozen old host source/artifact and successful legacy RPCs; no decoded INIT is claimed. Compatibility results and compatibility provenance remain separate, and probe time supplies no performance evidence.
Fixed data EOF does not cover every file API: fstat on an old fd can still use namespace-inode attributes. The VFS namespace-size boundary in copy_file_range is also unresolved: a 16384-byte source copies only 4105 bytes when its current namespace size is 4105. This stays a separate observation and is never counted as successful full copying. Another 19 short-read C cases pass, executing helpers and single-folio/readahead callbacks extracted from the actual kernel patch with minimal kernel-primitive stubs. They support local early-short-read error/fixed-EOF logic, without supplying live-guest kernel transport fault injection. Concurrency stress, warm-page retention after reclaim and snapshots still need separate validation. Ordinary CLI performance was subsequently measured in the independent four-arm comparison, without establishing complete semantic acceptance. Raw timing, counts and frozen evidence remain separately in benchmark/.data/dc17m/, benchmark/.data/dc17p/ and benchmark/.data/dc17/.
Linux: read-only local FLUSH elision
rg shows improvement signals of 17.55%, 16.91% and 17.22% across the three rounds. Cumulative three-round seven-tool time falls from 4315.230 ms to 3880.882 ms, a 10.07% reduction, 95% CI [-0.97%, 12.84%]. Overall improvement is not detected; that SDK/generic-VM entry defaults the preference off. The current scoped entry is covered by automatic FLUSH requests. The first-round seven-tool sum falls by 9.21% with an interval excluding zero; Ready and third-round npm have no detected difference. These results cover five independent environments under matching conditions and leave cross-runtime user tables unchanged.
Conditions and formal timing
On 2026-10-17, B-FS-ENG uses the same frozen GNU host and firmware with the new 0046 protocol, varying only PVISOR_VM_FS_READONLY_FLUSH_ELISION=0|1. Both arms reuse owned Immutable rootfs/workspace inputs and a frozen baseline. Directory-FD capacity is 256; lower negative caching and upper absence caching are disabled, with WB=0, DAX=0 and guest cache=1. Linux x86_64/KVM, guest 2 vCPU/16 GiB, normal PVisor, ManagedJob, stage/journal, VmExecutor and native-runner paths are retained, with the CLI Host service omitted. Sealing preparation is outside the clocks.
Each arm has five fresh VMs, randomized within seeded paired blocks, with nine operations in three resident rounds and no warmups. All ten formal environments pass normal exit, output, tool-cache inheritance, Run Bundle, lower isolation, every written file and all stream-byte checks, with zero failures. There is no quiet, interference or full-inventory gate; all valid slow samples remain. Ready excludes tools and exit, while worker clocks exclude launch and exit; stream_write retains its own fsync/close. Resident rounds are dependent, leaving five independent environments per arm. The cumulative metric sums 21 seven-tool worker clocks within each environment before taking the median; it is not complete-task wall time.
Values below are median milliseconds; positive reduction means faster. The 95% CIs use 5,000 paired-bootstrap resamples over five environment blocks.
| Metric | Disabled | Enabled | Reduction % | 95% CI % |
|---|---|---|---|---|
| Ready | 651.685 | 652.971 | -0.20 | [-8.47, 1.29] |
| Three-round seven-tool total | 4315.230 | 3880.882 | 10.07 | [-0.97, 12.84] |
| Round 1 seven-tool sum | 2078.682 | 1887.289 | 9.21 | [7.45, 11.37] |
| Round 2 seven-tool sum | 1141.847 | 1003.565 | 12.11 | [-12.96, 19.68] |
| Round 3 seven-tool sum | 1099.857 | 1010.897 | 8.09 | [-8.35, 11.86] |
| Round 1 rg | 304.416 | 250.993 | 17.55 | [16.27, 18.91] |
| Round 2 rg | 298.962 | 248.401 | 16.91 | [14.91, 19.14] |
| Round 3 rg | 299.662 | 248.057 | 17.22 | [15.94, 28.40] |
| Round 3 npm | 475.724 | 477.645 | -0.40 | [-31.96, 12.00] |
Full statistics, 32 paired comparisons and provenance retain full precision, ranges and per-environment values. Individual intervals have no multiple-comparison adjustment; the three rg results and aggregate metrics are also dependent. N=5 supports neither tail-latency claims nor a comprehensive no-regression guarantee. The first-round aggregate signal does not replace the three-round interval crossing zero. Write and npm have no detected difference in any round. Write has lower and higher observed values, while metadata/npm also vary substantially. N=5 is insufficient to establish formal clusters or exact attribution; write point estimates supply no speedup claim, and no samples are removed after collection.
Request changes and correctness boundaries
Independent B-FS-DIAG has one fresh environment per arm, both valid. Each has a unique final record for all 17 registered instances, with complete rootfs/workspace coverage of 216 phase-component intervals and 54 tokens. Actual negotiated settings are checked as 0/1 per mounted owner, capacity as 256, and both Core caches as disabled. The enabled counter records successful negotiation once during an owner's lifetime; this cohort uses single-session fresh VMs. Intervals include the checked() subprocess tree's startup, tool work and original validation, exceeding the worker-clock scope.
The table contains third-round counts, N=1 per arm. Seven-tool totals sum only those seven phases.
| Scope / request or flag | Disabled | Enabled |
|---|---|---|
| Rootfs seven-tool FLUSH | 1028 | 0 |
| Rootfs seven-tool OPEN / READ / RELEASE | 1052 / 0 / 1052 | 1052 / 0 / 1052 |
| Workspace seven-tool FLUSH | 2681 | 542 |
| Workspace seven-tool OPEN / READ / RELEASE | 2681 / 2480 / 2682 | 2681 / 2480 / 2682 |
| Rootfs npm FLUSH | 731 | 0 |
| Workspace rg FLUSH | 2051 | 1 |
| Workspace rg eligible OPEN flags | 0 | 2050 |
| Workspace write FLUSH | 513 | 513 |
rg retains 2051 each of OPEN, READ and RELEASE: the candidate removes FLUSH round trips for qualified read-only handles. The write phase has no eligible flags and retains its 513 FLUSH requests. Rootfs/workspace Core parent+leaf queries are 21652→21601 and 36962→36962. This does not establish unchanged total host queries: each candidate OPEN also checks native fstat, F_GETFL and fstatfs, which are outside Core query counts. Formal paired timing determines actual tool gains. Inclusive diagnostic spans are not added or converted into exact shares of worker elapsed time. Per-tool counters and counter provenance preserve the full scope.
After explicit connection bit 43 and per-OPEN bit 29 negotiation, the guest still runs write_inode_now, fuse_sync_writes, filemap_check_errors and their error returns before omitting backend FLUSH. Explicit fsync and RELEASE remain. Qualification uses the pinned read-only native FD after normal OPEN, Immutable-lower ownership and a local-filesystem allowlist; TTL and KEEP_CACHE do not expand. Sessions negotiating this capability currently reject snapshot capture/restore. Removing internal dup/close also supplies no guarantee of identical resource errnos.
Real-guest close probes pass all 11 cases with new firmware disabled/enabled and with old-firmware fallback. Their FLUSH total changes from 15 to 6 while every other protocol call count remains identical. Both ATIME arms pass 36 cases, preserving request-mask and cached-read behavior. Known old-lower-fd whole-page checks still fail all four cases in both arms, with output byte-identical to the established page-cache object-isolation issue. These failures establish neither feature correctness nor a basis for expanding workspace data caching. Independent probes and probe provenance retain all seven runs and unique final records for 84 registered instances. Probe elapsed times supply no formal performance samples. A separate old-host/new-firmware compatibility run passes 36 ATIME cases and matches the corresponding new-host-disabled observation's protocol call counts, retaining FLUSH. Reverse compatibility and its provenance remain separate. The old host has no new counters; fields are blank and do not establish an actual setting of zero. Raw timing, counts and frozen evidence remain separately in benchmark/.data/lf17m/, benchmark/.data/lf17p/ and benchmark/.data/lf17/.
Linux: physical-absence caching for an exclusive upper
Enabling physical-upper absence caching changes cumulative three-round seven-tool time from 4325.818 ms to 4321.941 ms, a 0.09% reduction, 95% CI [-3.04%, 4.93%]. There is no detected overall gain, and the cache remains disabled by default. Third-round rootfs physical queries fall by 71.47%, while workspace queries increase and third-round rg has a 2.18% regression signal. These results do not establish an overall tool speedup.
Question, conditions and timing results
Repeated resolution still verifies physical upper parents after hitting the Immutable-lower cache. An explicit exclusive-upper contract allows MissingLeaf / UnavailableParent results to survive a continuous read-only epoch. The engineering comparison tests whether those repeated queries account for a substantial part of current tool waits.
On 2026-10-17, B-FS-ENG varies only PVISOR_VM_FS_EXCLUSIVE_UPPER_ABSENCE_CACHE=0/1 using one new GNU engineering artifact and 0045 firmware. Both arms use the same owned Immutable rootfs/workspace generations, with a frozen workspace baseline. Directory-FD cache capacity is 256, lower negative caching is off, WB=0, DAX=0, guest cache=1, and profiling is disabled for formal timing. Execution uses Linux x86_64/KVM, guest 2 vCPU/16 GiB, and normal PVisor, ManagedJob, stage/journal, VmExecutor and native-runner paths. The CLI Host service is omitted and previously sealed input preparation is outside the clocks; ordinary CLI user tables remain unchanged.
Each arm has five fresh environments, shuffled within seeded paired blocks, with nine operations repeated three times per environment and no warmups. All ten environments pass normal-exit, output, cache-inheritance, Run Bundle, lower-isolation, complete written-byte and stream-byte checks, with zero failures. There is no interference, quiet-wait or full-inventory gate; all valid slow samples remain. Ready excludes tools and exit. Operations use worker clocks, excluding launch and exit; stream_write retains its own fsync/close. Resident rounds are dependent, leaving five independent environments per arm. The three-round seven-tool total sums 21 operation clocks within each environment before taking the median; it is not complete-task wall time.
Values below are median milliseconds. Positive reduction means faster; intervals use 5,000 paired-bootstrap resamples over five environment blocks for 95% CI.
| Metric | Upper cache off | Upper cache on | Reduction % | 95% CI % |
|---|---|---|---|---|
| Ready | 659.383 | 654.450 | 0.75 | [-0.41, 5.96] |
| Three-round seven-tool total | 4325.818 | 4321.941 | 0.09 | [-3.04, 4.93] |
| Round 1 seven-tool sum | 2086.825 | 2061.889 | 1.19 | [0.45, 7.23] |
| Round 2 seven-tool sum | 1129.029 | 1141.184 | -1.08 | [-10.31, 5.60] |
| Round 3 seven-tool sum | 1081.312 | 1063.091 | 1.69 | [-4.10, 7.67] |
| Round 1 npm | 764.821 | 702.667 | 8.13 | [0.54, 16.58] |
| Round 3 rg | 297.383 | 303.871 | -2.18 | [-2.65, -1.23] |
The first-round sum and npm have improvement signals; third-round rg has a regression signal. Ready, round-two/three sums and the three-round total have no detected difference. The 32 individual comparisons have no multiple-comparison adjustment, and N=5 supports neither tail-latency claims nor a comprehensive no-regression guarantee. First-round improvements do not replace the aggregate conclusion. Full statistics, paired intervals and provenance retain every operation, round and distribution.
Query reductions, additional implementation work and boundaries
Independent B-FS-DIAG has one fresh environment per arm, both valid. Each covers 27 phases across nine operations and three rounds, with 54 synchronous tokens. Four-component phase records are complete on rootfs/workspace, and all 17 registered instances per arm have a unique final record. Actual capacity is verified as 256 per mount; both Core owners match their arm's expected setting of 0 or 1. Counter intervals include the checked() subprocess tree's startup, work and original validation, exceeding the worker-clock scope. Diagnostic elapsed times supply no performance result.
The table sums seven-tool counts in round three, N=1 per arm. Core physical queries add parent-stat and leaf-stat units; cache hits refer only to the physical upper.
| Scope / counter | Upper cache off | Upper cache on |
|---|---|---|
| Rootfs Core physical queries | 21652 | 6178 |
| Rootfs upper-absence hits | 0 | 15475 |
| Rootfs MissingLeaf / UnavailableParent hits | 0 / 0 | 2410 / 13065 |
| Rootfs OPEN / READ | 1052 / 0 | 1052 / 0 |
| Workspace Core physical queries | 36903 | 38661 |
| Workspace upper-absence hits | 0 | 4748 |
| Workspace MissingLeaf / UnavailableParent hits | 0 / 0 | 4414 / 334 |
| Workspace upper-present misses | — (disabled) | 12444 |
| Workspace OPEN / READ | 2681 / 2480 | 2681 / 2480 |
Rootfs eliminates 15474 physical queries while workspace adds 1758. To collect complete parent evidence, the enabled miss path bypasses successful-prefix reuse within the same logical walk. Noncached upper Entry results also take that complete-validation path, so the 12444 upper-present misses add path work in this candidate implementation. These present queries include existing ancestor directories; their count does not place the rg corpus in upper. That corpus and the payload remain in the sealed lower. Counts identify work the cache has not eliminated, without independently measuring its elapsed contribution or exactly attributing the rg regression. Error-class cache misses and capacity evictions are zero in the enabled arm; the disabled arm performs no cache-query classification. Per-tool counters and counter provenance retain all phases, invalidations and classifications. Software-query counts are not disk I/O or an exact time decomposition.
Eligibility requires explicit exclusive-upper ownership, directory-permission synchronization and stable root, physical ancestors and mount identity. Each exclusive namespace operation suspends and clears the cache; guard drop clears again and resumes it, covering errors, partial publication, snapshots and teardown. Enabling rejects a journal that overlaps upper through an equal path, parent/child relationship or symlink alias. Only physical-upper MissingLeaf, UnavailableParent and complete successful parent evidence are retained. Entry attributes, errors, merged winners, policy, whiteout/opaque and journal decisions are not retained; guest TTL and data-page policy are unchanged. Ordinary Core/HOST paths infer none of this contract, and the default remains 0.
Physical-lower metadata caching, guest directory-image eligibility, frozen-baseline read-observation savings and data-page retention across OPENs are different mechanisms. Upper-absence hits do not remove the workspace's 2480 READ requests; Immutable workspace metadata eligibility does not automatically provide safe KEEP_CACHE. Reducing read cost further requires isolating page-cache semantics for old lower FDs and new upper FDs sharing one guest inode, followed by workspace data-page-retention validation. Current evidence is insufficient to enable physical-upper caching by default; WB also remains off. Raw timing and diagnostics remain separately in benchmark/.data/uc17m/ and benchmark/.data/uc17p/, with frozen sources, harness and analysis under benchmark/.data/uc17/.
Linux: rejected attribute-TTL candidate and page-cache object isolation
The candidate extending only Immutable regular-lower attribute TTL was rejected and removed because it leaves a hardlink source's nlink stale. Formal performance samples: 0. Independent B-FS-DIAG on 2026-10-17 uses the same frozen host, guest probe and 0045 firmware, varying only the candidate switch; WB=0 and DAX=0. A retained read-only fd first primes attributes with AT_EMPTY_PATH|AT_STATX_FORCE_SYNC, then link(a,b) runs. After 1.1 seconds, beyond the ordinary TTL, the same fd is queried directly without an intervening path stat. With the candidate disabled, ordinary and force-sync queries both return nlink=2; enabled, ordinary returns 1 and force-sync returns 2. This establishes incomplete invalidation of hardlink-source attributes and supports no GETATTR-reduction or tool-speedup claim. The frozen switch is no longer a current product setting. The original probe names this case link-opath, but this musl target includes O_PATH in O_ACCMODE, so Rust OpenOptions::custom_flags clears the bit and retains an ordinary read-only fd. These results do not establish O_PATH behavior. Raw openat, F_GETFL and EBADF controls in the data-mapping probe confirm the construction difference; historical raw output remains unchanged.
| Independent diagnostic | Candidate disabled | Candidate enabled | Established scope |
|---|---|---|---|
| Retained read-only fd hardlink source: ordinary / force-sync nlink | 2 / 2 | 1 / 2 | New stale attributes from the candidate |
| Old lower fd: full-content check after whole-page writes | 4/4 fail | 4/4 fail | Existing page-cache object-isolation gap |
| ATIME request-mask and attribute checks | 36/36 pass | 36/36 pass | Separate attribute diagnostics pass |
The whole-page probe opens an old read-only fd on an Immutable root lower, triggers copy-up through a writable fd, and uses pwrite to write 4 KiB or 8 KiB at offset 0. Before the writable OPEN, the old fd is either explicitly bound or still deferred, forming four independent cases; the latter still passes through mutation drain. Reads alternate with the same writable upper fd, checking the old fd first and verifying all 16 KiB each time. At both settings, every case reports an old-fd content difference at byte zero; upper-content checks report no difference. This confirms that the existing guest shared-inode/page-cache path does not fully isolate the original lower object from the new upper object, including with the candidate disabled. Expanding workspace KEEP_CACHE requires resolving this object-isolation boundary. These results do not cover mmap, concurrency, other offsets or every mount type.
Each ATIME arm passes 36 cases. This supplies no performance result and does not resolve the failures above. Other review-attrs assertions remain raw diagnostics requiring separate review; their aggregate failure count is not a count of independent product defects. Raw output and the rejection decision remain in benchmark/.data/ac17/probes/ and decision.json, alongside frozen candidate sources, binaries and firmware identity. The 12 decisive evidence rows and provenance summary contain only the eight whole-page cases, two retained-fd attribute results and two ATIME summaries above.
Linux: negative caching for Immutable physical lowers
Enabling negative caching changes cumulative three-round seven-tool time from 4380.075 ms to 4304.291 ms, a 1.73% reduction, 95% CI [-4.91%, 4.18%]. There is no detected overall gain, and negative caching remains disabled by default. Independent diagnostics reduce third-round rootfs Core physical queries by 20.47%, establishing that the mechanism removes repeated missing-leaf queries without establishing a tool speedup.
Question, conditions and timing results
Repeated resolution still physically queries leaves already confirmed absent from an Immutable lower. The engineering comparison tests whether retaining that result reduces Ready and resident-tool waits while preserving upper, other-lower, access-policy and journal semantics.
On 2026-10-17, B-FS-ENG varies only PVISOR_IMMUTABLE_LOWER_NEGATIVE_CACHE=0/1 using one new GNU engineering artifact and 0045 firmware. Both arms use the same genuinely owned Immutable rootfs and workspace generations, with a frozen workspace baseline. Directory-FD cache capacity is 256 in both; WB=0, DAX=0, guest cache=1, and profiling is disabled for formal timing. Linux x86_64/KVM, guest 2 vCPU/16 GiB, and normal PVisor, ManagedJob, stage/journal, VmExecutor and native-runner paths are retained, with the CLI Host service omitted. Previously sealed inputs are prepared outside the clocks; ordinary CLI user tables remain unchanged.
Each arm has five fresh environments, shuffled within seeded paired blocks, with nine operations repeated three times per environment and no warmups. All ten environments pass output, cache-inheritance, Run Bundle, lower-isolation, complete written and stream-byte, and normal-exit checks, with zero failures. There is no interference, quiet-wait or full-inventory gate; all valid slow samples remain. Ready ends at the unique ready output, excluding tools and exit. Operations use worker clocks, excluding launch and exit; stream_write retains its own fsync/close. Resident rounds are dependent, leaving five independent environments per arm. The cumulative seven-tool metric sums 21 operation clocks within each environment before taking the median; it is not complete-task wall time.
Values below are median milliseconds. Positive reduction means faster; intervals use 5,000 paired-bootstrap resamples over five environment blocks for 95% CI.
| Metric | Negative cache off | Negative cache on | Reduction % | 95% CI % |
|---|---|---|---|---|
| Ready | 656.562 | 652.746 | 0.58 | [-0.62, 0.95] |
| Three-round seven-tool total | 4380.075 | 4304.291 | 1.73 | [-4.91, 4.18] |
| Round 1 seven-tool sum | 2106.067 | 2107.373 | -0.06 | [-7.14, 5.96] |
| Round 2 seven-tool sum | 1136.160 | 1115.354 | 1.83 | [-7.60, 4.49] |
| Round 3 seven-tool sum | 1127.554 | 1108.215 | 1.72 | [-13.52, 10.31] |
All 32 intervals cross zero: Ready, nine operations in each of three rounds, three per-round sums and the three-round total. No individual or aggregate difference is detected. Individual intervals have no multiple-comparison adjustment; N=5 supports neither tail-latency claims nor a comprehensive no-regression guarantee. Full statistics, paired intervals and provenance retain per-tool distributions and full precision.
Query changes and optimization boundaries
Independent B-FS-DIAG has one fresh environment per arm, both valid. Each covers 27 phases across nine operations and three rounds, with 54 synchronous tokens. Four-component phase records are complete on rootfs/workspace, and each arm has a unique final record for all 17 registered instances. Actual capacity is checked as 256 per mount; both Core owners in each arm match its expected negative-cache setting of 0 or 1. Counter intervals include the checked() subprocess tree's startup, work and original validation, exceeding the worker-clock scope. Instrumented elapsed times supply no performance result.
The table sums seven-tool counts in round three, N=1 per arm. Core physical queries add parent-stat and leaf-stat units.
| Scope / counter | Negative cache off | Negative cache on |
|---|---|---|
| Rootfs Core physical queries | 21652 | 17220 |
| Rootfs MissingLeaf misses | 674 | 0 |
| Rootfs negative hits | 0 | 674 |
| Rootfs OPEN / READ | 1052 / 0 | 1052 / 0 |
| Workspace Core physical queries | 37861 | 38323 |
| Workspace MissingLeaf misses | 2 | 0 |
| Workspace negative hits | 0 | 2 |
| Workspace UnavailableParent misses | 8 | 8 |
| Workspace OPEN / READ | 2681 / 2480 | 2681 / 2480 |
The 674 repeated rootfs MissingLeaf queries become negative hits, eliminating 4432 physical queries. Workspace replaces only two MissingLeaf queries; all eight unavailable-parent results are still queried afresh. Error-class misses are zero in both arms. Workspace physical queries do not fall, and actual OPEN/READ counts remain unchanged. Software-query counts are not disk I/O and cannot be converted into exact time attribution or explain every tool difference. Per-tool counters and counter provenance retain complete phases and instance coverage.
The mechanism retains only eligible Immutable physical-lower MissingLeaf results and their complete parent identities. Each request still checks upper, whiteouts, opaque markers, other lowers, access policy and read observations. Errors, UnavailableParent and merged-view absence are not retained, and guest negative-dentry TTL is unchanged. Positive and negative entries share the existing 4096-entry bound and clear-on-capacity eviction. Eligibility requires the namespace, ancestors, mount identity and hardlink aliases to remain truly stable for the owner's lifetime; an ordinary directory, read-only mount or frozen baseline alone does not establish it. Unset or 0 keeps the feature disabled.
Further optimization must first address the confirmed page-cache object-isolation boundary, alongside reducing duplicate OPEN-path work while retaining real object binding. The attribute-TTL candidate was rejected and removed because it leaves hardlink nlink stale, with zero formal performance samples. The negative-cache query reduction is insufficient to support enabling it by default. WB remains off, and final-syncfs ENOENT after unlink is unresolved by this change. Raw timing and diagnostics remain separately in benchmark/.data/nc17m/ and benchmark/.data/nc17p/, with frozen sources, harness and analysis under benchmark/.data/nc17/.
Linux: directory-FD cache capacity and ATIME invalidation
Increasing directory-FD cache capacity from 256 to 1024 changes cumulative three-round seven-tool time from 4279.878 ms to 4267.253 ms, a 0.29% reduction, 95% CI [-0.91%, 1.89%]. There is no detected overall gain, and default capacity remains 256. Hot rootfs directory-cache misses and evictions disappear while Core physical queries barely change. A separate ATIME probe distinguishes the effects of reading data and requesting attributes.
Conditions and timing results
On 2026-10-17, B-FS-ENG varies only directory-FD cache capacity, 256 / 1024, using the same frozen GNU engineering artifact and 0045 firmware. Both arms use genuinely owned Immutable rootfs and workspace inputs, with a frozen workspace baseline; WB=0, DAX=0, guest cache=1. Execution retains normal PVisor, ManagedJob, stage/journal, VmExecutor and native-runner paths and omits the CLI Host service, so Ready is not comparable across cohorts with ordinary CLI user tables. Previously sealed input generations are reused; preparation is outside Ready and tool clocks.
Each arm has five fresh environments, shuffled within seeded paired blocks, with the original nine operations repeated three times per environment. All ten formal environments pass normal exit, output, cache-inheritance, Run Bundle, lower-isolation and complete written-byte checks. There is no interference, quiet-wait or full-inventory gate, and all valid slow samples remain. Ready excludes tools and exit; operations use worker clocks. The cumulative three-round seven-tool metric sums 21 operations within each environment before taking the median, leaving five independent samples.
Values below are median milliseconds. Positive reduction means faster; intervals use 5,000 paired-bootstrap resamples for 95% CI.
| Metric | Capacity 256 | Capacity 1024 | Reduction % | 95% CI % |
|---|---|---|---|---|
| Ready | 653.418 | 652.628 | 0.12 | [-0.62, 5.38] |
| Three-round seven-tool total | 4279.878 | 4267.253 | 0.29 | [-0.91, 1.89] |
| First-round npm | 751.310 | 674.267 | 10.25 | [1.63, 11.91] |
First-round npm has an improvement signal; Ready and the cumulative total have no detected difference. The 32 individual comparisons have no multiple-comparison adjustment, and N=5 supports no tail-latency claim. This isolated signal is insufficient to justify increasing the default. Full statistics, paired intervals and provenance retain every operation and round.
Counters and remaining optimization scope
Independent B-FS-DIAG has one fresh environment per capacity, both valid, with complete four-component phases on rootfs/workspace and final records for every registered instance. In the third-round seven-tool sum, rootfs directory-FD cache misses and evictions each fall from 252 to zero, while Core parent-stat plus leaf-stat changes only from 21,653 to 21,652. Avoiding native directory-handle reconstruction does not remove Core path validation; a cache-miss reduction does not establish a tool speedup.
At either capacity, all 674 rootfs Immutable-cache misses concern missing physical-lower leaves, with zero error-class misses. Workspace has two missing-leaf and eight unavailable-parent misses, also with zero error-class misses. These classifications narrow the next investigation. The independent negative-cache comparison removes repeated MissingLeaf queries, with no detected gain in cumulative tool time; upper, whiteout and merged-namespace checks must remain. Per-tool counters and counter provenance preserve phase boundaries and complete-instance coverage. Software-query counts do not measure disk I/O or provide exact time attribution.
ATIME causality in read→statx
An independent SDK probe with the existing firmware requests SIZE|MTIME, ATIME and BASIC_STATS on root lower, root upper, Immutable-share lower and Mutable-share lower files. Each case first refreshes basic attributes with AT_STATX_FORCE_SYNC, then compares no read, a first read, and a cached read on the same fd. Synchronous ioctls bracket prime, read, first stat and repeated stat separately. All 36 cases, 144 phases and 288 tokens are complete; the three devices have four components each, with a unique final record for all 12 registered instances. No sleeps are inserted.
| Data access and subsequent request | Cases | Host OPEN / READ in read phase | GETATTR in first stat |
|---|---|---|---|
| No read, any of the three masks | 12 | 0 / 0 | 0 |
| First read, then SIZE/MTIME | 4 | 4 / 4 | 0 |
| First read, then ATIME/BASIC | 8 | 8 / 8 | 8 |
| Cached read on the same fd, any mask | 12 | 0 / 0 | 0 |
Each of 36 forced primes issues one GETATTR; all 36 immediately repeated stats issue none. Prime-to-first-query age is only 2.535–4.834 ms, well below the ordinary one-second attribute deadline. All eight ATIME/BASIC queries observe changed access times. The result supports selective ATIME invalidation after an actual host READ, with no repeated invalidation on a same-fd page-cache hit. It does not attribute all GETATTR requests to ATIME. Instrumented syscall durations and inclusive spans supply no performance result. Case counts and diagnostic provenance retain complete boundaries. Raw timing, counters and probe evidence remain separately in benchmark/.data/fc17m/, benchmark/.data/fc17p/ and benchmark/.data/fc17/.
Linux: four-arm comparison with owned-input caching
Enabling Immutable cache eligibility for the sealed rootfs reduces the third-round seven-tool sum from 1581.62 ms to 1173.57 ms, a 25.80% reduction. Enabling the workspace snapshot as well gives 1267.91 ms, a 19.83% reduction. Workspace treatment alone has no detected difference in the third-round sum, and the seven-tool sum has not reached a twofold speedup. Rootfs data caching removes actual READ requests; workspace metadata optimization retains the cost of opening and reading files.
Conditions and timing boundaries
B-FS-ENG uses one frozen GNU engineering artifact and 0045 firmware through ordinary PVisor, ManagedJob, stage/journal, VmExecutor and native-runner execution. The entry omits the CLI Host service; ordinary CLI inputs do not automatically acquire this ownership or cache eligibility. Linux x86_64/KVM, guest 2 vCPU/16 GiB, whole parent CPUs 0,1, two-core quota, 16 GiB and zero swap, warm host inputs, and independent upper, Job, workspace and task tool caches. WB=0, DAX=0, guest cache=1, with profiling disabled for timing.
All rootfs arms use the same genuinely imported, sealed physical directory, varying only its Mutable/Immutable declaration. Baseline and rootfs-only workspaces use independent live Mutable copies. Workspace-only and combined arms use a sealed snapshot with identical initial bytes, a frozen baseline and an Immutable lower; the apply target remains the independent trial workspace. Workspace treatment therefore jointly changes cache eligibility and read-observation/journal work. SnapshotBase authenticates its generation from a trusted store and holds a lease through Job completion and native teardown. The store remains after execution; no additional persistent pin is created. One-time import and sealing take 51.048 seconds, separately from Ready and tool clocks.
Each condition has five fresh environments, shuffled within seeded blocks, with nine operations repeated three times per environment: 20 valid environments and zero failures. Ready ends at the unique ready output, excluding tools and exit. Tool clocks use worker timings; stream_write retains explicit fsync/close. Normal exit, outputs, cache inheritance, Run Bundle, lower isolation, all 256 written files and three complete stream files are checked. There is no quiet wait, interference monitor or full-inventory gate; all valid slow samples remain. Resident rounds are dependent, leaving five independent environments per condition.
Timing results
Milliseconds, medians, N=5 per condition. The seven-tool sum is computed within each environment and round before taking the median.
| Metric | Baseline | Sealed rootfs | Snapshot workspace | Both |
|---|---|---|---|---|
| Ready | 679.46 | 659.22 | 665.09 | 652.77 |
| Seven-tool sum, round 1 | 2448.27 | 2479.10 | 2325.91 | 2009.04 |
| Seven-tool sum, round 2 | 1955.95 | 1348.25 | 1470.78 | 1432.07 |
| Seven-tool sum, round 3 | 1581.62 | 1173.57 | 1545.61 | 1267.91 |
Positive reduction means faster. With 5,000 paired bootstrap resamples over the five environments, third-round rootfs reduces time by 25.80%, 95% CI [10.27%, 45.13%]; both reduce it by 19.83% [1.07%, 56.33%]. Workspace-only is 2.28% [-5.29%, 44.11%], with no detected difference. Both reduce the first-round sum by 17.94% [13.87%, 33.87%]. Rootfs and both reduce Ready by 2.98% [2.02%, 29.88%] and 3.93% [1.99%, 40.32%]; workspace-only crosses zero. Baseline retains a slow Ready sample of 1093.86 ms and a third-round sum of 2903.71 ms, producing wide intervals. N=5 does not support tail-latency claims; the 93 individual comparisons have no multiple-comparison adjustment.
Third-round tool medians follow. Adding the row medians does not produce the median of the per-environment sum.
| Third-round tool | Baseline | Sealed rootfs | Snapshot workspace | Both |
|---|---|---|---|---|
| Traverse 2048 files | 138.23 | 164.51 | 121.75 | 137.17 |
| Read and verify 64 MiB | 82.90 | 32.93 | 83.34 | 79.71 |
| Overwrite 256 files | 118.57 | 84.65 | 130.81 | 153.37 |
| git status | 35.31 | 24.99 | 14.66 | 8.23 |
| rg search | 348.42 | 327.20 | 323.56 | 299.50 |
| Incremental Cargo build | 34.14 | 20.64 | 33.04 | 19.72 |
| npm install check | 767.75 | 548.32 | 788.16 | 536.36 |
With both enabled, npm, Cargo, git and rg fall by 30.14%, 42.23%, 76.68% and 14.04%, respectively, with individual intervals excluding zero. Traversal, read and write have no detected difference. Hot-open and stream_write intervals also cross zero in every arm. Combined treatment has no established advantage over rootfs-only; their sum medians do not establish which is faster. Four-arm statistics, paired intervals and provenance retain full values and ranges.
Request evidence and remaining opportunities
Independent B-FS-DIAG has one fresh environment per condition, covering 27 phases across nine operations and three rounds, with 54 tokens synchronously checkpointed on rootfs and workspace. The four conditions have 13/13/17/17 registered instances, all with final records, and complete per-component phase coverage on both mounts. Counter intervals include the checked() subprocess tree's startup, operation and original validation, exceeding the worker-clock scope. Instrumented elapsed times supply no performance result.
The table sums the seven tools in round three. Core physical queries add parent-stat and leaf-stat units: software-query counts that do not measure disk I/O or provide exact time attribution.
| Scope / counter | Baseline | Sealed rootfs | Snapshot workspace | Both |
|---|---|---|---|---|
| Rootfs OPEN | 1052 | 1052 | 1052 | 1052 |
| Rootfs READ | 1475 | 0 | 1475 | 0 |
| Rootfs LOOKUP | 3656 | 948 | 3618 | 948 |
| Rootfs Core physical queries | 99828 | 21653 | 99679 | 21807 |
| Workspace OPEN | 2681 | 2681 | 2681 | 2681 |
| Workspace READ | 2480 | 2480 | 2480 | 2480 |
| Workspace LOOKUP | 2102 | 2084 | 306 | 306 |
| Workspace Core physical queries | 91327 | 91160 | 38745 | 36962 |
Rootfs READ disappears while OPEN remains, supporting data-page reuse with continued object binding for actual reads. Workspace LOOKUP and physical queries fall, while OPEN/READ stay identical, explaining its limited broad tool benefit. Zero third-round READINDEX does not establish an unused directory image: import occurs in earlier phases. Across all three rounds of seven tools, workspace content fingerprinting falls from 2156 calls and 69,375,691 bytes in baseline to one call and zero bytes in snapshot conditions. This also exposes the frozen baseline's removal of read-observation work. Per-phase counters and counter provenance retain boundaries and coverage evidence.
That cohort did not cover the ordinary CLI. Subsequent prepared-rootfs, prepared-workspace and four-arm DATA/FLUSH comparisons independently measured those CLI paths while retaining leases, stage/apply and external-modification boundaries; they do not constitute complete semantic acceptance. In this cohort, KEEP_CACHE mainly applies to the root device, so an Immutable workspace's metadata eligibility does not automatically supply equivalent data caching. The separate isolated-data-page protocol measures object isolation and page reuse and remains disabled by default. Ordinary OPEN checks and binding costs remain. WB stays off, and the final-syncfs ENOENT after unlink remains unresolved; these results do not justify enabling writeback. Raw timing and diagnostics remain separately in benchmark/.data/oc16m/ and benchmark/.data/oc16p/, with preparation, artifacts, harness and analysis under benchmark/.data/oc16/.
Linux: quick retest of guest lifetime fixes
Patch 0045 fixes reproduced deferred-open object-binding and poll-mask failures, without an established overall speedup. Ready and all three seven-tool sums have intervals crossing zero; third-round npm has a regression signal. With writeback enabled, both firmware versions fail the ordinary CLI's final barrier with ENOENT after unlink, leaving no valid performance conclusion for that condition.
Motivation and experiment design
Measure the cost of preserving lookup, object-binding and final RELEASE lifetimes in directory images, deferred OPEN and batched writeback. Patch 0045 reuses native READDIRPLUS parallel lookup/alias splicing; regular-file mutations block new deferred-open publication from pending-open drain through the host reply; timestamp, xattr and hard-link changes gain binding points; the queue's final reference preserves synchronous auto-submount RELEASE; failed poll binding returns EPOLLERR. An independent host profile-registration change completes diagnostic instance accounting.
B-FS-ENG cohort flife16b uses the same current GNU release/gateway host binary, SHA256 0bc3de591c8444d74b8b67a409bab17dc8712311e81477d42d0281469f8678f0, switching only final-0044 versus additional-0045 firmware. Both enable guest cache and disable writeback, DAX and profiling. Linux x86_64/KVM, CPUs 0,1, whole-parent quota of two cores / 16 GiB / zero swap; CLI guests have two vCPUs/16 GiB and a Btrfs workspace. Independent SDK guests have two vCPUs/512 MiB, private tmpfs fixtures/uppers, an explicit Immutable share and no journal. Cohorts remain separate.
Each firmware has five fresh CLI and five fresh SDK environments, randomly interleaved within paired trials, seed 20261016, no extra warmups and three resident rounds per environment. CLI runs the same nine operations, tool caches and full byte/Bundle/lower-isolation checks. SDK performs 256-path stat, a scan of 300 subdirectories and 10,000 open/fstat/close calls, checking fixed counts/sizes and exit. Startup ends at the unique Ready; operation clocks exclude startup and exit. The seven-tool sum is calculated within each environment/round before taking its median. All 20 environments pass, with zero failures. There is no interference or full-inventory gate, and valid slow samples remain. Ordinary Mutable CLI inputs do not establish directory-image hits.
Data and analysis
Values are medians; negative changes mean faster. Intervals use 5,000 paired bootstrap resamples over five independent environment indices. Three rounds do not create fifteen independent samples. The local derived CSV contains all 49 comparisons, ranges and individual values; the same-batch provenance CSV identifies artifacts and failed evidence. Individual intervals have no multiple-comparison adjustment. N=5 supports quick observations, with no tail-latency or overall no-regression guarantee.
| Metric | Round | 0044 ms | 0045 ms | Change | 95% CI % |
|---|---|---|---|---|---|
| CLI Ready | — | 761.446 | 724.310 | -4.88% | [-32.23, +2.42] |
| CLI seven-tool sum | 1 | 3085.999 | 3055.917 | -0.97% | [-24.78, +8.06] |
| CLI seven-tool sum | 2 | 1821.624 | 1793.154 | -1.56% | [-5.46, +7.92] |
| CLI seven-tool sum | 3 | 1696.279 | 1673.227 | -1.36% | [-3.61, +6.48] |
| CLI hot open ×10,000 | 3 | 10.298 | 10.346 | +0.46% | [-13.86, +16.49] |
| CLI 8 MiB stream + fsync/close | 3 | 467.809 | 489.954 | +4.73% | [-15.89, +8.95] |
| CLI npm | 3 | 866.880 | 890.301 | +2.70% | [+1.86, +10.90] |
| SDK stat ×256 | 1 | 4.452 | 4.402 | -1.11% | [-3.49, +4.41] |
| SDK scan 300 directories | 1 | 31.887 | 29.767 | -6.65% | [-27.91, +5.89] |
| SDK scan 300 directories | 3 | 0.174 | 0.171 | -1.66% | [-6.94, +8.23] |
| SDK stat ×256 | 2 | 0.153 | 0.187 | +22.32% | [+0.78, +26.96] |
| SDK hot open ×10,000 | 3 | 5.089 | 5.047 | -0.84% | [-3.35, -0.01] |
Forty-four of 49 intervals cross zero. Third-round npm increases by 23.42 ms (+2.70%); second-round SDK stat increases by 0.034 ms. SDK hot open falls by 0.067/0.043 ms in rounds two/three, and second-round stream close falls by 0.024 ms. Both directions remain visible; isolated signals do not establish stable speedups. The baseline Ready values retain a valid slow sample of 1148.71 ms.
Correctness evidence and unresolved paths
Independent real-guest verified-current.json records 27 checks matching their expectations. Four timestamp/setxattr/removexattr/hard-link failures with writeback off and four with it on, plus one poll failure, produce nine baseline failures that all pass under 0045. The held reader returns original instead of the incorrect modified; poll returns only POLLERR. The full probe passes concurrent directory access, aliases, unlink, copy-up, partial-image and unmount checks. Normal writeback, backpressure, close/unmount and injected EIO-to-125 cases pass. The BDI probe checks the root and additional share by their actual mount device, retaining the original strict/max/min assertions.
Independent counter diagnostics cover 12 registered PID/component/instance identities, all with final records, across protocol, dispatch, overlay and Core. Python checks reject missing whole instances/components and non-final reports. Legacy unregistered logs remain partial evidence. Rust Core passes 146 tests and VM passes 417; diagnostic Python passes 14 and firmware bundle/ABI checks pass two. KASAN, long race testing and same-connection auto-submount stress were not run; passing ordinary concurrency/multi-mount probes does not prove complete P1 coverage. Deferred descriptors in descendants of a recursively materialized directory rename still need dedicated coverage; the current gate covers regular-file endpoints.
Both writeback-on arms of initial cohort flife16 exit 125 because final workspace syncfs returns ENOENT; that entire attempt supplies no performance conclusion. Minimal diagnostic flifediag16b shows successful directory open, ENOENT on the first syncfs after unlinking a closed file, and zero on the second. The host has removed the inode path with no surviving handle; subsequent ctime SETATTR fails. This path remains unresolved. Skipping the error or reverting to an older supervisor cannot produce valid timing evidence.
Raw evidence remains in benchmark/.data/flife16b/report.json and per-task logs. benchmark/.data/fs-review-20261016/ retains the patch, both firmware binaries/sources, build logs, frozen launch entries, derive.py and correctness logs. Initial reused-target artifacts with an older embedded guest supervisor remain diagnostic only; the final build reruns the VM build script, checks the current supervisor and repeats every functional check. These results leave the existing cross-runtime user tables intact and do not estimate gains relative to main.
Linux: paired N30 comparison of filesystem optimizations with default-off writeback
Independent B-FS-ENG cohort fof1, N=30 with three warmups per arm. These tables attribute the measured combined variant/default configuration; screening cohorts, historical switch experiments and cross-runtime user cohorts remain separate.
The control is the frozen SHA939 build; selected C3 is the frozen SHA884 build containing queue hot-path, handle-lease and Linux regular-file metadata changes, plus default-off writeback for new VMs. Neither arm supplies WRITEBACK/WORKERS environment overrides: the baseline uses its enabled default and C3 its disabled default. Attribution therefore applies only to the combined code/default configuration. Frozen source, artifact and firmware identities remain in the local batch provenance records. Linux/KVM/FUSE/Btrfs, warm host caches, a new VM, private user/mount/PID namespace, owned pivot_root, workspace and tool caches per trial; whole parent CPUs 0,1, quota two, 16 GiB and zero swap, guest 2 vCPU/16 GiB. Fresh Host-listener startup is included in completion and cannot be subtracted from the warm-listener cross-runtime cohort. Three warmups and thirty seed-20261011 randomized paired rounds per arm; all sixty formal tasks and six warmups pass seven-tool outputs, full 256×64KiB bytes, Run Bundle, host isolation, input/artifact/budget and external interference gates. Environment observation proves visible exec-time variable inheritance, not precise FUSE INIT negotiation; short, inaccessible or unrecognized interference may be missed. Profiling is disabled with no speed-based exclusions. Earlier N5/N10 screens selected C3 and contribute no samples or uncertainty to this cohort.
Selected C3 (new-VM writeback off by default)
| Metric | N per arm | Baseline ms | Candidate ms | Change | 95% CI ms | 95% CI % | Conclusion |
|---|---|---|---|---|---|---|---|
| First valid output Ready | 30 | 693.90 | 692.75 | -0.16% | [-5.30, +2.71] | [-0.76, +0.39] | No detected difference |
| Launch through complete result | 30 | 4333.52 | 4257.06 | -1.76% | [-285.78, -7.65] | [-6.29, -0.18] | Faster |
| Launch through normal exit | 30 | 4546.35 | 4467.53 | -1.73% | [-269.88, -9.92] | [-5.70, -0.22] | Faster |
| Internal seven-tool total | 30 | 3641.73 | 3562.54 | -2.17% | [-284.47, -9.52] | [-7.39, -0.27] | Faster |
| Traverse 2,048 files | 30 | 149.13 | 132.08 | -11.43% | [-36.77, +9.16] | [-23.74, +6.36] | No detected difference |
| Read and verify 64 MiB | 30 | 114.58 | 115.66 | +0.95% | [-0.43, +5.00] | [-0.37, +4.38] | No detected difference |
| Write 256 files | 30 | 159.77 | 137.11 | -14.19% | [-28.72, -14.98] | [-17.58, -9.82] | Faster |
| git status | 30 | 381.61 (n=22); 770.02 (n=8) | 369.18 (n=24); 736.44 (n=6) | — | — | — | Separated clusters; no overall ranking |
| Ripgrep search | 30 | 422.94 | 424.78 | +0.43% | [-5.80, +9.07] | [-1.36, +2.18] | No detected difference |
| Offline Cargo build | 30 | 484.65 | 482.34 | -0.48% | [-6.58, +4.43] | [-1.35, +0.92] | No detected difference |
| Offline npm install | 30 | 937.03 | 920.09 | -1.81% | [-34.38, -0.98] | [-3.63, -0.10] | Faster |
Milliseconds; negative changes indicate lower latency. Intervals use 5,000 same-cohort paired bootstrap resamples. Valid slow samples remain; separated clusters receive no overall P50, percentage or ranking. No P95/P99 is reported.
The same-cohort full-precision CSV and artifact, configuration and provenance records remain in the local batch or archive. Raw evidence is at benchmark/.data/fof1/report.json; acceptance is benchmark/.data/fof1/derived/audit.json.
Linux: paired comparison with guest writeback disabled
Disabling writeback reduces 256 × 64 KiB write time from 162.10 ms to 131.61 ms, a decrease of 18.81%, with 95% CI [-25.06%, -12.87%]. Neither completion nor internal seven-tool time has a detected difference. rg and Cargo increase by 1.82% and 1.08%; Git and disabled-condition npm have separated clusters. The detected benefit is confined to this write workload.
Control and timing boundaries
B-FS-ENG uses one frozen GNU release/gateway artifact, SHA256 ae221676e4bb04231c88f2ce17c2570824f4064f8a3a63d6ef32817b0e2afa98, including direct queue service, heavy-operation stealing and scoped I/O fences. Conditions only set host-runner PVISOR_VM_FS_WRITEBACK to 1 / 0; a dedicated worker restores and verifies the originating environment. Firmware, seven-tool workload, inputs, workspaces and tool-cache policy are identical. Rootfs/workspace attachments have no DAX window.
Linux/KVM/FUSE/Btrfs, warm host caches, fresh VMs, private user/mount/PID namespaces and owned pivot_root per trial. The whole parent uses CPUs 0,1, a two-core quota, 16 GiB and zero swap; guests have 2 vCPU/16 GiB. Input/namespace preparation is excluded. Fresh Host-listener startup, VM launch and exit enter completion; operations use the original workload's internal timer and include output validation. Profiling is disabled.
Each arm has 3 warmups and 30 seeded shuffled paired rounds, totaling 60 measured tasks. All 66 runs pass output, normal exit, Run Bundle, host isolation and full-byte validation of the 256 upper files. Input/artifact digests match, with no OOM, 0 failures and 0 exclusions. External build/test polling every 0.5 s detects no interference but can miss brief or inaccessible activity. There are 5,000 paired bootstrap resamples; slow valid samples remain, distributions are checked first, and P95/P99 are not reported.
Seven operations and complete waiting
Units are ms, N=30 per arm. Change is disabled relative to enabled; the 95% CI is for the median-time difference. Separated distributions show each cluster's median and count, with no overall P50, percentage or ranking.
| Metric | Writeback on ms | Writeback off ms | Change | 95% CI ms | Conclusion |
|---|---|---|---|---|---|
| First valid output (Ready) | 696.95 | 694.99 | -0.28% | [-4.96, +2.39] | no detected difference |
| Launch to full result | 4409.19 | 4363.77 | -1.03% | [-247.19, +262.05] | no detected difference |
| Launch to normal exit | 4616.37 | 4564.87 | -1.12% | [-250.56, +271.96] | no detected difference |
| Internal seven-tool total | 3699.55 | 3660.70 | -1.05% | [-259.00, +263.60] | no detected difference |
| Traverse 2,048 files | 148.93 | 145.89 | -2.04% | [-26.36, +19.23] | no detected difference |
| Read and verify 64 MiB | 114.83 | 116.22 | +1.21% | [-1.53, +2.47] | no detected difference |
| Write 256 × 64 KiB | 162.10 | 131.61 | -18.81% | [-41.05, -20.17] | faster |
| git status | 391.26 (n=23); 759.78 (n=7) | 375.22 (n=21); 751.37 (n=9) | — | — | Separated clusters; no overall ranking |
| rg | 420.05 | 427.67 | +1.82% | [+1.09, +14.25] | slower |
| Offline Cargo compile | 485.05 | 490.29 | +1.08% | [+0.35, +12.54] | slower |
| Offline npm install | 941.86 | 937.78 (n=22); 1661.33 (n=8) | — | — | Separated clusters; no overall ranking |
The completion median difference is -51.50 ms, with 95% CI [-250.56, +271.96] ms. Internal task time differs by -38.86 ms, interval [-259.00, +263.60] ms. The write improvement does not yield a detected overall benefit; these timings do not establish READ request counts or specific lock costs. Both Git conditions and disabled-condition npm have separated clusters; all samples are retained and displayed separately.
The complete statistics CSV and artifact, switch, budget and provenance records remain in the local batch or archive. Raw evidence is under benchmark/.data/writeback-quick-20261011/; frozen harness, execution and acceptance records are under benchmark/pvisor/.data/writeback-ab-20261011/. This cohort has N=30 per arm despite its directory name and is independent of the N=10 direct-queue retest and read-only DAX experiment. The historical enabled/disabled conditions remain intact; the current new-VM default follows the selected frozen source.
Linux: paired DAX comparison for an immutable read-only share
DAX has substantial tradeoffs in this workload and does not justify default enablement. The first two-thread 64 MiB read is 29.69% faster and repeated sequential reads are 17.38% faster. The first sequential read is 8.72% slower, repeated small-file reads are 44.37% slower, and the first page-stride access to a 64 MiB mmap is 339.59% slower. Metadata has no detected difference. The measured scope is an explicit immutable share; writable CLI workspaces and startup/exit regressions were not retested by this experiment.
Control and timing boundaries
B-FS-ENG uses one frozen performance artifact (opt-level 3, Thin LTO). Both conditions create a read-only device and a 128 MiB DAX window through the public immutable_filesystem API. Only the guest mount option changes, from dax=never to dax=inode. Every trial verifies the expected statx DAX attribute; the disabled condition retains the same device and window configuration. The host is a Ryzen 7 9700X running Linux 7.2.8; the guest runs Linux 6.12.109. Both use the same Btrfs backing and firmware, warm host content caches, and a fresh VM with private rootfs upper/work directories.
The complete campaign and VMs inherit CPU 0,1 affinity and share a two-core quota, 2 GiB memory.max, zero swap and a 65,536 FD limit; guests have 2 vCPU/512 MiB. The user cgroup lacks a cpuset controller, so actual affinity/quota is verified before and after. Profiling is disabled. Each condition has 3 warmups followed by 30 pairs in a predetermined balanced random order, totaling 60 measured VMs. All 6 warmups and 60 measured runs passed correctness and exited normally. Input/artifact digests match before/after, with no OOM, 0 failures and 0 exclusions. An observer outside the group scanned for external builds/tests every 0.5 seconds, 123 times, and detected none; brief or other host activity may escape detection.
Each guest runs metadata → small files → sequential read → mmap → two-thread read. Data classes use independent files while sharing the window and its reclamation state. Metadata stats 2,048 paths. Small-file reads open/read/close 128×64 KiB files, whose 2 MiB mapping-slot demand exceeds the window. Large files are 64 MiB each: read uses 64 KiB pread calls on an already-open FD; the first mmap phase includes mapping and one byte read per 4 KiB page, while repeats retain the mapping; parallel includes creating and joining two reader threads. Full-byte validation is outside each phase timer. First file-data access does not mean cold storage or an empty DAX window.
Guest CLOCK_MONOTONIC_RAW records phases. Repeated read/parallel values are the per-pass average of 4 passes, mmap averages 16 passes, and other phases use one pass. The table reports medians of these 30 samples. CIs use 5,000 paired bootstrap resamples, calculating the difference and percentage between each resample's condition medians; intervals crossing zero are labeled no detected difference. The preregistered adjacent-gap/cluster-size rule detected no separated clusters. All slow valid samples remain; P95/P99 are not reported.
Same-batch results
Units are ms. Change is enabled relative to disabled; positive values mean slower. The 95% CI is for the percentage change.
| Operation | DAX off ms | DAX on ms | Change | 95% CI | Conclusion |
|---|---|---|---|---|---|
| 2,048-path stat: first | 129.0957 | 130.0621 | +0.75% | [-8.33%, +11.32%] | no detected difference |
| 2,048-path stat: repeated | 0.9369 | 0.9690 | +3.43% | [-5.26%, +11.44%] | no detected difference |
| 128×64 KiB open/read/close: first | 40.2088 | 41.4687 | +3.13% | [-0.68%, +5.74%] | no detected difference |
| 128×64 KiB open/read/close: repeated | 25.3731 | 36.6306 | +44.37% | [+36.47%, +47.98%] | slower |
| 64 MiB sequential pread: first | 60.6072 | 65.8917 | +8.72% | [+7.11%, +9.84%] | slower |
| 64 MiB sequential pread: repeated | 5.5443 | 4.5805 | -17.38% | [-21.40%, -10.10%] | faster |
| 64 MiB mmap page-stride access: first | 23.8292 | 104.7507 | +339.59% | [+328.77%, +352.40%] | slower |
| 64 MiB mmap page-stride access: repeated | 0.0964 | 0.1252 | +29.90% | [+27.00%, +33.71%] | slower |
| 64 MiB two-thread pread: first | 54.4338 | 38.2736 | -29.69% | [-32.16%, -28.25%] | faster |
| 64 MiB two-thread pread: repeated | 4.7336 | 4.1625 | -12.07% | [-16.90%, +0.74%] | no detected difference |
The first mmap adds about 80.92 ms, while each warm sequential read saves about 0.96 ms. Reducing data READ requests is insufficient to offset the current first-access cost. Repeated small-file open/read/close also regresses consistently. Initial mapping, page faults, window reclamation and host mapping contention require separate diagnosis; these paired phase times do not attribute the difference to one lock or step. DAX is disabled by default with explicit opt-in retained. First mmap and window pressure need investigation before integrating read-only tool/image paths. The disabled experimental condition still reserves a window, so its cost does not exactly represent an ordinary device without one.
The complete statistics CSV, provenance and validation summary remain in the local batch or archive. The entry and reproduction instructions are in repository benchmark/filesystem/README.md. Raw logs, frozen source and artifacts are local under benchmark/filesystem/.data/dax-20261011-final/. This engineering batch is independent of the seven-tool, cross-runtime and historical startup datasets.
Linux: direct queue service and scoped fences, 60-sample quick retest
Scheduling fixes show an improvement trend; the write regression remains. Against the previous concurrency artifact, VM rg, Cargo and npm are about 7.54%, 4.10% and 4.64% faster in this batch. Internal task time falls about 2.71%, but its interval crosses zero. Write is still about 32.40% slower than the earlier optimized artifact. Each cell has only N=10: this is an exploratory direction check, not formal 30-round performance acceptance.
Changes and experiment design
Each queue thread directly waits for and consumes its own kick, admits requests, executes and publishes completion. Ordinary requests no longer use a coordinator-to-owner wake handoff. Stealing only considers a heavyweight operation running for at least 2 ms with actual ring backlog; admission rechecks eligibility under the ring lock. Short metadata operations cannot be stolen merely because their owner is busy. The 2 ms threshold is an elapsed-time heuristic, not proof of kernel sleep. The control thread checks rescue every 2 ms; idle queue threads wait indefinitely.
Ordinary I/O obtains a native Arc lease under short handle-map/admission locks without a namespace operation guard. Namespace mutations remain serialized, but close admission and drain I/O only for affected files, directory subtrees and known object aliases. Release waits only for its handle. Scoped fences remain through mutation and reopen on failure; new I/O on unrelated handles can enter while a writer waits. Snapshot/restore/destroy retain a global admission fence and drain all I/O. Writeback and host FUSE dispatch are unchanged.
The frozen GNU release/gateway candidate has SHA256 ae221676e4bb04231c88f2ce17c2570824f4064f8a3a63d6ef32817b0e2afa98. Controls in the same cohort are previous concurrency build2 and earlier candidate6; the latter is a recovery reference, not the literal parent of cf8bfa5. The original seven-operation workload, firmware, complete tool inputs and timing boundaries are retained. Linux/KVM/FUSE/Btrfs; whole parent CPUs 0,1, two-core quota, 16 GiB, zero swap; VM 2 vCPU/16 GiB. Each trial owns a fresh namespace, pivot_root, workspace and tool caches. Host caches are warm. Fresh Host-listener/VM startup and exit enter completion; input/namespace preparation is excluded. Profiling is off.
At the user's request, the 180-sample attempt was cancelled and retained separately. A new 60-sample batch runs three versions and two backends, each with 3 warmups and 10 shuffled paired rounds, seed 20261010. All 60 timed tasks and 18 warmups passed the original workload, Run Bundle, isolation and full-byte checks for 256 × 64 KiB upper files. Inputs/artifacts match before/after; no external build/test interference was detected. Polling every 0.5 s may miss brief or inaccessible activity. All slow valid samples remain; no P95/P99 is reported. Intervals from 5,000 paired bootstrap resamples are exploratory only.
Quick results and remaining issues
Units are ms, N=10 per arm. The previous condition is the same-cohort concurrency artifact; the candidate uses direct queues. The 95% CI is an exploratory median-difference interval. All seven operations, internal total, Ready/Result and normal exit are listed separately.
| Backend | Metric | Previous ms | Candidate ms | Change | 95% CI ms | Conclusion |
|---|---|---|---|---|---|---|
| staged | First valid output (Ready) | 218.77 | 217.92 | -0.39% | [-2.07, +2.81] | no detected difference |
| staged | Launch to full result | 1432.62 | 1431.14 | -0.10% | [-9.49, +15.92] | no detected difference |
| staged | Launch to normal exit | 1668.79 | 1667.37 | -0.09% | [-20.76, +28.91] | no detected difference |
| staged | Internal seven-tool total | 1213.94 | 1213.16 | -0.06% | [-7.08, +16.04] | no detected difference |
| staged | Traverse 2,048 files | 66.31 | 65.26 | -1.58% | [-1.32, -0.31] | faster |
| staged | Read and verify 64 MiB | 68.04 | 68.75 | +1.03% | [-1.30, +4.92] | no detected difference |
| staged | Write 256 × 64 KiB | 27.67 | 27.12 | -1.99% | [-1.64, +0.56] | no detected difference |
| staged | git status | 143.37 | 141.31 | -1.43% | [-5.07, +1.35] | no detected difference |
| staged | rg | 106.64 | 106.09 | -0.52% | [-1.78, +0.69] | no detected difference |
| staged | Offline Cargo compile | 77.50 | 76.54 | -1.24% | [-1.90, +9.94] | no detected difference |
| staged | Offline npm install | 226.99 | 230.30 | +1.46% | [+0.62, +6.67] | slower |
| VM | First valid output (Ready) | 691.96 | 693.36 | +0.20% | [-7.61, +5.32] | no detected difference |
| VM | Launch to full result | 4408.21 | 4303.32 | -2.38% | [-198.58, +264.50] | no detected difference |
| VM | Launch to normal exit | 4595.45 | 4484.43 | -2.42% | [-222.17, +248.70] | no detected difference |
| VM | Internal seven-tool total | 3707.29 | 3606.71 | -2.71% | [-200.10, +264.86] | no detected difference |
| VM | Traverse 2,048 files | 148.97 | 142.88 | -4.09% | [-34.00, +57.34] | no detected difference |
| VM | Read and verify 64 MiB | 116.58 | 116.24 | -0.29% | [-5.80, +2.48] | no detected difference |
| VM | Write 256 × 64 KiB | 153.00 | 157.08 | +2.67% | [-21.79, +28.41] | no detected difference |
| VM | git status | 404.51 | 387.07 | -4.31% | [-43.16, +362.83] | no detected difference |
| VM | rg | 453.05 | 418.87 | -7.54% | [-52.35, -19.30] | faster |
| VM | Offline Cargo compile | 508.94 | 488.07 | -4.10% | [-30.01, -11.13] | faster |
| VM | Offline npm install | 975.21 | 929.92 | -4.64% | [-142.85, -34.51] | faster |
Against previous concurrency, VM internal task P50 is 3707.29 → 3606.71 ms (-2.71%), difference interval [-200.10, 264.86] ms. Completion is 4595.45 → 4484.43 ms (-2.42%), interval [-222.17, 248.70] ms. Both cross zero, so overall recovery is not established.
- rg is 453.05 → 418.87 ms (-7.54%), exploratory difference interval [-52.35, -19.30] ms.
- Cargo is 508.94 → 488.07 ms (-4.10%), interval [-30.01, -11.13] ms.
- npm is 975.21 → 929.92 ms (-4.64%), interval [-142.85, -34.51] ms.
- Write is 153.00 → 157.08 ms (+2.67%), interval [-21.79, 28.41] ms, with no detected improvement. Metadata/read/Git also have no detected difference.
Against same-cohort candidate6, VM internal task is 3621.29 → 3606.71 ms (-0.40%), with an interval crossing zero; rg/npm also have no detected difference. Write is 118.64 → 157.08 ms (+32.40%), exploratory difference interval [9.88, 63.74] ms, and remains the main unresolved item. Staged internal work is 1213.94 → 1213.16 ms and completion 1668.79 → 1667.37 ms, both without a detected difference. Its small-sample metadata/npm changes are not attributed to unused VM execution changes. Comparisons use only this cohort, without pooling previous medians or attributing separate contributions to the three fixes.
VM library tests pass 363 with 8 skipped; all-target Clippy and warnings-denied rustdoc pass. Regressions cover direct kick/stop, non-stealing of short requests, long-request backlog completion on its original ring, same-object waits, independent namespace mutation and new unrelated I/O admission during a wait. Snapshot/lifecycle tests are retained. After the measurement build, existing cfg(test) device tests were only moved to the end of their file for lint; production implementation matches.
Quick statistics, exploratory intervals and artifact, cancellation and provenance records remain in the local batch or archive. Raw evidence is under benchmark/.data/direct-queue-quick-20261011/; frozen source, build, preflight, cancellation, validation and static checks are under benchmark/pvisor/.data/direct-queue-retest-20261011/. This batch is not expanded or substituted into cross-runtime user tables. Write still needs separate diagnosis; cold storage, concurrency throughput and macOS are not covered.
Linux: concurrency refactor retest, 2026-10-11
This batch does not resolve all filesystem regressions. Against the pre-refactor artifact, staged completion improves by about 5.00%, while internal task time has no detected difference. VM internal task time increases by about 4.78%, with detected regressions in write, rg and npm. Implementing multiple queues, dedicated workers and handle leases is not performance acceptance.
Motivation and experiment design
This experiment checks dedicated hiprio service, multiple normal queues and queue threads, direct execution and pending-descriptor stealing, staged guest writeback, leased I/O, and startup/exit cleanup changes. The candidate is build2, a frozen GNU release/gateway build of the current uncommitted source, SHA256 87ebb0658f2df6a84f9e4eca29c8d3d8bc01923817f04432780272c8b1b30309. The other arms are the earlier candidate6 and a control reversing only 65e65c93 and 09bd1d59. That control retains other changes and default stage synchronization; it is not the literal parent of cf8bfa5. This is a version comparison, not attribution of every difference to one optimization.
Linux/KVM/FUSE/Btrfs, identical firmware and complete tool inputs. The whole parent group uses CPUs 0,1, a two-core quota, 16 GiB and zero swap; the VM has 2 vCPUs and 16 GiB. Each arm/backend has 3 warmups and 30 shuffled paired rounds, seed 20261010, warm host caches, fresh workspaces/tool caches, and a private user/mount/PID namespace with owned pivot_root per trial. Namespace/input preparation is excluded; a fresh Host listener, VM startup and exit are included in completion. The original seven-operation reference workload and timer are used, without profiling; this is not hyperfine.
Data and analysis
Units are ms, N=30 per arm. The previous condition is the same-cohort optimized artifact before the refactor; the candidate is the concurrency-refactor artifact. The 95% CI is for the median difference; separated distributions retain cluster medians and counts.
| Backend | Metric | Previous ms | Candidate ms | Change | 95% CI ms | Conclusion |
|---|---|---|---|---|---|---|
| staged | First valid output (Ready) | 229.99 | 219.25 | -4.67% | [-11.62, -9.23] | faster |
| staged | Launch to full result | 1452.13 | 1424.04 | -1.93% | [-38.42, -8.24] | faster |
| staged | Launch to normal exit | 1755.90 | 1668.16 | -5.00% | [-99.79, -66.71] | faster |
| staged | Internal seven-tool total | 1221.64 | 1204.69 | -1.39% | [-21.77, +0.03] | no detected difference |
| staged | Traverse 2,048 files | 66.75 | 66.35 | -0.60% | [-0.71, +0.03] | no detected difference |
| staged | Read and verify 64 MiB | 67.20 | 67.62 | +0.62% | [-0.82, +1.47] | no detected difference |
| staged | Write 256 × 64 KiB | 27.76 | 26.67 | -3.92% | [-1.84, -0.68] | faster |
| staged | git status | 142.65 | 141.87 | -0.54% | [-2.02, +1.26] | no detected difference |
| staged | rg | 107.21 | 107.58 | +0.34% | [-0.41, +1.26] | no detected difference |
| staged | Offline Cargo compile | 71.79 | 70.61 | -1.64% | [-2.77, +0.59] | no detected difference |
| staged | Offline npm install | 230.26 | 230.26 | -0.00% | [-2.28, +2.13] | no detected difference |
| VM | First valid output (Ready) | 701.29 | 693.92 | -1.05% | [-15.10, +0.22] | no detected difference |
| VM | Launch to full result | 4278.45 | 4446.60 | +3.93% | [+65.69, +210.06] | slower |
| VM | Launch to normal exit | 4535.76 | 4635.26 | +2.19% | [-1.90, +148.13] | no detected difference |
| VM | Internal seven-tool total | 3578.18 | 3749.07 | +4.78% | [+107.48, +210.48] | slower |
| VM | Traverse 2,048 files | 157.80 | 138.86 | -12.00% | [-35.21, +1.45] | no detected difference |
| VM | Read and verify 64 MiB | 117.67 | 116.86 | -0.69% | [-3.52, +0.19] | no detected difference |
| VM | Write 256 × 64 KiB | 131.05 | 163.68 | +24.90% | [+15.38, +42.35] | slower |
| VM | git status | 375.05 (n=24); 749.92 (n=6) | 399.04 (n=25); 798.60 (n=5) | — | — | Separated clusters; no overall ranking |
| VM | rg | 426.74 | 450.55 | +5.58% | [+16.56, +36.92] | slower |
| VM | Offline Cargo compile | 501.38 | 502.77 | +0.28% | [-6.34, +10.58] | no detected difference |
| VM | Offline npm install | 923.22 | 973.34 | +5.43% | [+31.98, +62.59] | slower |
All 180 formal tasks and 18 warmups passed the original task, Run Bundle, isolation and full byte checks for all 256 × 64 KiB upper files. Complete input inventories match before/after. Intervals use 5,000 paired-round bootstrap resamples; all slow valid samples are retained, with no P99. Against candidate6:
- Staged completion P50 is 1755.90 → 1668.16 ms: -87.74 ms, CI95 [-99.79, -66.71]. Internal task time is 1221.64 → 1204.69 ms, with difference interval [-21.77, 0.03] crossing zero. Write improves by about 3.92%; other operations have no detected difference.
- VM internal task time is 3578.18 → 3749.07 ms: +170.89 ms, CI95 [107.48, 210.48]. Write is 131.05 → 163.68 ms (+24.90%), rg 426.74 → 450.55 ms (+5.58%), and npm 923.22 → 973.34 ms (+5.43%). All three difference intervals exclude zero; metadata, read and cargo have no detected difference.
- VM completion is 4535.76 → 4635.26 ms, with difference interval [-1.90, 148.13] crossing zero. Better exit handling cannot conceal slower internal work. Git has separated clusters in both arms: baseline cluster medians 375.05/749.92 ms with 24/6 samples, candidate 399.04/798.60 ms with 25/5. No whole-distribution median ranking is made.
- Against the same-cohort rollback control, VM internal work is still 4.45% slower, write 24.59%, rg 6.17%, and npm 4.86%, with all these difference intervals excluding zero. Staged internal task time has no detected difference.
The first formal attempt was rejected for external Cargo activity; its 27 samples are retained separately. Only the new batch is used above, with no interference detected by 0.5 s external build/test polling, which may miss brief, inaccessible or unrecognized activity. Initial VM preflight also exposed a race between an empty-ring check and guest descriptor publication. The fix was rebuilt from newly frozen source and passed preflight; a new 5,000-publication concurrency regression test passed. Related library tests passed 633 with 19 skipped; after the fix, VM library tests passed 361 with 8 skipped. Full CLI integration testing had Host-listener/namespace environment failures and is not reported as a complete pass.
Full statistics, paired intervals and artifact, control-scope and provenance records remain in the local batch or archive; see the separate startup/exit retest. Raw report and per-trial evidence are under benchmark/.data/concurrency-formal2-20261011/; builds, rejected attempts and validation scripts are under benchmark/pvisor/.data/concurrency-retest-20261011/. These engineering results do not replace historical cross-runtime user tables or establish cold-disk, concurrency-throughput or macOS performance. VM write/tool costs and staged startup variability require separate diagnosis.
Idle request dispatch in Linux staged execution
A controlled engineering A/B finds that idle dispatch reduces staged write time by 19.27%, Git by 12.78%, search by 12.88%, and the complete seven-tool task by 2.86%; no difference is detected for reading or startup. This covers Linux staged only. It does not rescale the cross-runtime user table or establish VM, macOS, cold-disk or concurrent-throughput results.
Motivation, implementation and experiment design
Responsiveness during copying and everyday tool cost must be evaluated together. The previous scheduler hands even idle short requests to a worker, adding thread switches. The fix executes mutations requiring no copy preparation directly when the mutation lane is idle; reads execute directly only when both lanes are idle. READ requests of at least 64 KiB retain worker dispatch for bulk-read pipelining. Accepted requests or active copy preparation keep reads on their independent bounded queue; inode pins, FIFO, capacity limits and shutdown draining remain enforced. Baseline fingerprints, journals, durability and isolation retain their existing semantics.
Measured 2026-10-10 on Linux x86_64 / Fedora 7.2.8-200.fc44.x86_64 / Ryzen 7 9700X / Btrfs. Both release artifacts use one frozen source; the candidate changes only host dispatch, private tests and API/README documentation. The whole parent uses CPUs 0,1, a two-core quota, 16 GiB memory and zero swap. Host caches are warm; every task has a fresh workspace and private tool caches, Python bypasses bytecode and Node caching is enabled. The seven workloads match B-FS-TOOLS, with default serial stage synchronization.
Every sample uses independent user/mount/PID namespaces and an owned pivot_root, binding workspace and stage to the same Btrfs storage. Namespace creation, binary copies and input preparation are untimed; a fresh Host listener is included in complete-task timing. Absolute times therefore are not pooled with the user page's cross-runtime configuration. Each arm has three warmups and 30 seeded randomly paired rounds, seed 20261010, without profiling, using the original reference task timer rather than hyperfine. All 60 formal tasks and six warmups pass output, Run Bundle, host-isolation and full-byte checks of all 256 upper files; input inventories match before and after. An external observer checks same-user builds/tests every 0.5 seconds and rejects the entire cohort on detection. None is detected; short, inaccessible or unrecognized activity can be missed.
Engineering results and correctness boundaries
Milliseconds, P50, N=30 per arm. Change is candidate relative to baseline; intervals use 5,000 paired-round bootstrap resamples. No distribution triggers the separated-cluster rule, and no P99 is reported.
| Metric | Baseline ms | Fixed ms | Change and 95% CI |
|---|---|---|---|
| Tool Ready | 231.34 | 231.15 | -0.08% [-0.87%, +0.41%]; no detected difference |
| Complete seven-tool task and exit | 1826.42 | 1774.15 | -2.86% [-3.57%, -1.22%] |
| Traverse 2,048 files | 67.69 | 66.88 | -1.20% [-1.99%, -0.81%] |
| Read and verify 64 MiB | 72.05 | 70.12 | -2.68% [-6.31%, +4.80%]; no detected difference |
| Write 256 files | 35.09 | 28.33 | -19.27% [-20.37%, -18.47%] |
| git status | 162.31 | 141.56 | -12.78% [-13.35%, -12.15%] |
| Ripgrep search | 122.74 | 106.93 | -12.88% [-13.50%, -12.17%] |
| Offline Cargo build | 79.37 | 77.06 | -2.92% [-4.21%, -1.63%] |
| Offline npm install | 231.70 | 229.50 | -0.95% [-1.74%, -0.06%] |
The complete-task median difference is -52.27 ms, 95% CI [-65.35, -22.30] ms. The read interval includes zero, so no read-speed gain is claimed. All 68 ordinary Rust tests, seven real Linux FUSE mount tests, targeted Clippy and warnings-denied rustdoc pass. Coverage retains metadata/readonly access during copying, saturation, FIFO, worker and inline shutdown draining, cache notifications and parallel mount stress. This fix has no macOS performance acceptance yet.
The idle-dispatch summary CSV and source, artifact and provenance records remain in the local batch or archive. Raw reports, stdout, budget and namespace receipts remain in benchmark/.data/fr10fixf3/; frozen sources, build receipts, publication checks and external interference records remain in benchmark/pvisor/.data/filesystem-regression-20261010/. Raw and intermediate diagnostic samples are retained and excluded from formal statistics.
Linux VM worker scheduling and completion wakes
In the controlled Linux VM engineering comparison, the fix reduces complete-task latency by 3.15%, 64 MiB read/verify latency by 3.06%, and offline Cargo build latency by 3.14%. Other metrics show no detected difference or separated clusters. Against the control reverting only the two recent changes, Traverse 2,048 files, Read and verify 64 MiB, Offline Cargo build still show detectable costs; complete recovery of single-request costs is not established. This is B-FS-ENG evidence, kept separate from the staged engineering cohort and cross-runtime user tables. It does not establish macOS, cold-disk or concurrent-throughput results.
Motivation, implementation and experiment design
Offloading large reads and directory requests leaves metadata/hiprio admission responsive, but worker migration, receiver selectors and completion wakes add tool latency for uncontended requests. The fix reuses the first worker whenever all in-flight requests have cleared, reducing migration for uncontended requests. Requests arriving with work in flight retain the original shared FIFO and parallel receivers for bursts. The dedicated idle inlet has capacity one and counts against the same total bound covering queued, executing and unpublished completions. The owner retains RAM lease management. Before waiting, the owner atomically arms and checks the completion channel; after sending completion, workers atomically disarm and signal only an armed owner. Ready completions use a zero-timeout poll that still checks stop first. Large READ/directory requests remain asynchronous, the owner alone publishes the used ring, and shutdown drains before joining all workers.
Measured on 2026-10-11: Linux x86_64 / Fedora 7.2.8-200.fc44.x86_64 / Ryzen 7 9700X / Btrfs. Three release artifacts share the same frozen October 10 source: the reverted control reverses only 65e65c93 and 09bd1d59; the current baseline retains those changes and the host idle-dispatch fix; the candidate changes only the VM worker implementation, private tests and crate README relative to that baseline. The reverted control retains all other source and serial stage-sync defaults. It is unrelated to the October 6 historical cohort.
The whole parent has CPUs 0,1, a two-core quota, 16 GiB and no swap; VMs have 2 vCPUs and 16 GiB guest RAM with the same firmware, tools and inputs. Host caches are warm; every trial has a fresh workspace and separate tool caches, Python reads/writes no bytecode, and Node caching is enabled. Each trial owns a private user/mount/PID namespace, pivot_root, fresh VM and Host listener. Namespace/input preparation is outside the timer; launch and exit are included in completion. Workspace/stage remain Btrfs binds. Each artifact has 3 warmups and 30 randomly paired rounds, seed 20261010. Timing uses the original reference task timer, not hyperfine, with profiling disabled.
All 90 formal tasks and 9 warmups passed output, Run Bundle, host isolation, complete bytes in all 256 upper files and before/after input-inventory checks. Same-user build/test polling every 0.5 s detected no interference; short, inaccessible or unrecognized activity may be missed. All valid slow samples remain. This cohort is retained separately and does not fill other cohorts.
Controlled results and remaining costs
Units ms, N=30 per artifact. Values are normally P50; separated clusters show their medians and counts without an overall ranking. Intervals use 5,000 paired-round bootstrap resamples. No P99 is reported.
| Metric | Current baseline ms | Fixed ms | Change and 95% CI |
|---|---|---|---|
| Tool Ready | 702.39 | 701.45 | -0.13% [-0.39%, +0.41%]; no detected difference |
| Complete seven-tool task and exit | 4741.87 | 4592.36 | -3.15% [-6.14%, -1.23%] |
| Traverse 2,048 files | 154.58 | 159.74 | +3.34% [-11.45%, +10.03%]; no detected difference |
| Read and verify 64 MiB | 120.47 | 116.78 | -3.06% [-3.89%, -0.96%] |
| Write 256 files | 130.89 | 130.24 | -0.50% [-9.19%, +9.89%]; no detected difference |
| git status | 436.55 | 371.64 (25/30); 617.08 (5/30) | Separated clusters; no overall ranking |
| Ripgrep search | 417.92 | 424.90 | +1.67% [-1.01%, +5.40%]; no detected difference |
| Offline Cargo build | 523.22 | 506.79 | -3.14% [-4.46%, -0.53%] |
| Offline npm install | 926.99 | 923.10 | -0.42% [-1.88%, +0.63%]; no detected difference |
Recovery uses the reverted control from this same cohort, rather than historical page percentages:
| Metric | Reverted control ms | Fixed ms | Change and 95% CI |
|---|---|---|---|
| Complete seven-tool task and exit | 4553.30 | 4592.36 | +0.86% [-1.41%, +2.43%]; no detected difference |
| Traverse 2,048 files | 132.99 | 159.74 | +20.12% [+1.50%, +35.87%] |
| Read and verify 64 MiB | 114.36 | 116.78 | +2.12% [+0.80%, +3.71%] |
| Offline Cargo build | 488.23 | 506.79 | +3.80% [+2.84%, +5.71%] |
Against the control reverting only the two recent changes, Traverse 2,048 files, Read and verify 64 MiB, Offline Cargo build still show detectable costs; complete recovery of single-request costs is not established. The three artifacts include recent scheduling and journal semantic changes, so remaining gaps cannot all be attributed to one worker handoff. Metrics with separated clusters have no single overall ranking. All 359 VM tests, targeted Clippy, warnings-denied rustdoc and real CLI/guest execution passed. Coverage includes idle-worker reuse, metadata behind long requests, out-of-order completion, retained RAM leases, nonparking ready completions and freeze drain. macOS performance has not been accepted.
The VM scheduling statistics CSV and source, artifact and provenance records remain in the local batch or archive. Raw reports and trial evidence remain in benchmark/.data/fr10vmfixf/; frozen source, builds and publication checks are in benchmark/pvisor/.data/filesystem-regression-20261010/. These absolute times are not joined to the configuration on the cross-runtime user page.
Optimization candidates after the fixes
Prioritize repeated physical checks during path resolution, then the cache contract for immutable rootfs inputs, directory requests and completion notifications. Three instrumented diagnostics support this investigation order; speedups for these candidates remain unmeasured.
Motivation and experiment design
On 2026-10-11, B-FS-DIAG runs three independent VM seven-tool tasks using the final frozen candidate5 release above (SHA-256 a4cfdbc6e2657f9ff6a43a4c640cd472c1c94c965c9d388924e58727dc55556d). Inputs, firmware, private namespaces/owned pivot_root, whole-parent CPUs 0,1 / two-core quota / 16 GiB / zero swap and tool-cache policy match the earlier experiment. Filesystem profiling and startup timing are enabled; stderr goes to regular files. There are no warmups, version controls or external build/test interference monitoring. These diagnostics do not enter user tables or performance acceptance.
All three tasks pass tool output, Run Bundle, host isolation and full-byte checks of 256 upper files; input inventories match before and after. Each has 13/13 final profile instances, retaining the last cumulative record by PID/component/instance and separating equal-numbered supervisor and VMM instances. The table aggregates the two active VM instances. Cumulative spans for a label can overlap across workers; they cannot establish task-time fractions, predicted speedups or attribution to individual tools.
Request costs and candidate priorities
| Observation | Range across three tasks | Implication |
|---|---|---|
Core path resolve, cumulative inclusive span |
368.6–378.8 ms | Investigate repeated path validation first |
| Core physical parent stat count | 186,401–187,722 | Deep paths still repeat many checks per entry |
| Core parent identity statx count | 109,564–110,238 | Preserve identity validation; evaluate reuse within one request |
| Worker queue and completion wait, sum of cumulative spans | 84.0–93.5 ms | Dispatch costs remain; preserve responsiveness during long I/O |
| Used interrupt count across both VM instances | 37,572–37,660 | Investigate batching and notification opportunities |
| Priority | Candidate | Required contract checks and experiment |
|---|---|---|
| 1 | Reuse validated parent/leaf information between Core and VM backing | Core resolves metadata before VM native lookup performs openat/statx again. Evaluate passing validated identities and owned backing handles within one request; preserve host replacements, mount identity, hard-link denials and reference release after errors. Measure deep-path metadata, READDIRPLUS and Cargo separately. |
| 2 | Metadata/data caches for explicitly immutable rootfs inputs | A guest read-only mount can still be modified by its host; input lifetime or invalidation must establish immutability. Reduce Core physical queries before evaluating guest request counts; retain external-change visibility for live workspaces. Measure first access, warm caches and TTL expiry separately. |
| 3 | Separate ordinary READDIR and READDIRPLUS service paths | Ordinary READDIR usually consumes OPENDIR name/type snapshots; PLUS resolves fresh attributes per entry. Evaluate bounded snapshot handling and parent reuse in batches; preserve old-handle fallbacks, lock waits, large directories, deletion, permissions and cookies/restoration. Moving every directory request inline is not justified. |
| 4 | Worker dispatch and completion/interrupt batching | Preserve shared load balancing, long-read offload, owner-only virtqueue publication, RAM leases and freeze draining. Three earlier timing attempts for a per-worker queue candidate were rejected for external build/test interference; it remains unmerged. Add mixed long/short request and saturation correctness coverage before an independent 30-round A/B. |
| 5 | Repeated fingerprint and persistence work | Each workspace performs 2,157 content fingerprints, with 46.3–51.9 ms cumulative spans. Investigate repeated observations/batching while retaining preimages before first mutation, journal order, durability and recovery; delaying records is not an equivalent low-cost substitute. |
Linux local reads in this frozen artifact use preadv directly into guest descriptor buffers; the diagnostic does not establish a benefit from eliminating another intermediate copy. Independent DAX and writeback switch results are now available in the read-only share comparison and writeback comparison; guest-local/block rootfs lacks corresponding acceptance. These three diagnostic trials have no per-tool checkpoints, so overlapping spans cannot establish the timing share of metadata, read or Cargo.
Raw evidence: benchmark/.data/fr11explore/report.json, frozen runner.py/child.py/harness/, artifact/source receipts, per-task stderr/stdout, diagnostic-summary.json and counter-summary.csv. Formal candidates continue through B-FS-ENG acceptance: same-source randomized pairing, three warmups/30 rounds, correctness and interference gates. A passing candidate can then justify repeating the cross-runtime user matrix.
Concurrent host access during copying and fingerprinting
Independent engineering A/B on Apple M4 / APFS / macFUSE FSKit shows that host scheduling and journal-lock changes allow unrelated short file requests to overlap a 1 GiB copy or hash. The gain is responsiveness during blocking work; complete seven-tool tasks, Linux FUSE, VM and cold disks have no corresponding new performance conclusions. These three independent B-FS-ENG cohorts are not pooled or used to rescale the cross-runtime tool baseline.
Motivation and experiment design
A first write to a large file triggers copy-up, and a first read observation triggers content fingerprinting. Evaluate unrelated access waiting, idle request overhead and long-operation completion together to judge the scheduling benefits and costs.
Measured 2026-10-10 on Apple M4, 24 GiB RAM, Darwin 27.0.0 / arm64, APFS, macFUSE 5.4.0 / FSKit, Rust 1.98.0 release, without fixed CPU affinity or whole-host resource limits. Each A/B freezes the same source and dependencies, restoring/retaining only its selected changes. Copy-up scheduling baseline files come from 392c9d99; read-dispatch/journal-lock baseline files come from f109dd25, with candidate source 09bd1d59. Other changes remain identical within each comparison; the two comparisons do not share one candidate artifact.
Each cell has three warmups and 30 formal paired rounds, with seed 4207 shuffling conditions and A/B order. Inputs are warm-cache allocated deterministic 1 GiB files, fresh upper/work and independent paths. Copy experiments use real host mounts; journal experiments use one shared native Core without FUSE. Probes require an actually incomplete temporary copy, or evidence that the first content read occurred while hashing remains active, without artificial delay. Read probes release OPEN, READ and enumeration simultaneously and independently check that copying is still active, preventing an earlier blocking probe from turning later probes into idle measurements.
Untimed checks cover complete lower/upper bytes, identity, hardlinks, held descriptors, rename, temporary-copy cleanup, journal fingerprints and normal unmount; native journal trials verify all 129 observations. Visible build/test interference is checked before, every 250 ms during and after each trial. Errors, missed windows or detected interference fail the whole cohort. Reports retain zero formal failures and zero slow-sample exclusions; every valid slow sample remains. Visible-process sampling cannot exclude short or inaccessible activity.
Tables use milliseconds, N=30 per baseline/candidate cell, normally P50. Separated distributions list cluster medians and counts without a whole-distribution ranking. Intervals use 5,000 paired-round bootstrap resamples; P95 is descriptive only, with no P99. Formal timing has no profiling instrumentation.
Copy-up scheduling: metadata responsiveness
| Journal condition | Operation | Baseline ms | Candidate ms | Median change and 95% CI |
|---|---|---|---|---|
| nojournal | First stat during copying | 802.858 | 0.681 | -99.915% [-99.919%, -99.911%] |
| nojournal | 64-path stat during copying | 836.938 | 20.999 | -97.491% [-97.545%, -97.422%] |
| nojournal | 1 GiB writable-open | 803.733 | 819.464 | +1.957% [-0.896%, +4.095%]; no detected difference |
| nojournal | Idle 64-path stat | 34.558 | 34.596 | +0.108% [-8.278%, +7.639%]; no detected difference |
| compact | First stat during copying | 790.321 | 1.655 | -99.791% [-99.816%, -99.782%] |
| compact | 64-path stat during copying | 827.025 | 34.640 | -95.811% [-95.854%, -95.739%] |
| compact | 1 GiB writable-open | 1232.667 | 1231.293 | -0.111% [-1.280%, +1.470%]; no detected difference |
| compact | Idle 64-path stat | 32.165 | 34.069 | +5.921% [+2.299%, +10.745%] |
Candidate 64-path stat completes before copying in 30/30 samples in both conditions; baseline first stat waits for copying to finish. The trigger occurs after byte copying begins, excluding earlier baseline-fingerprint waiting. Writable-open includes fingerprinting, copying, publication and protocol return; neither condition detects a median difference. Compact idle batches increase by 1.90 ms, absolute 95% CI [+0.76, +3.36] ms, precluding a general claim of faster everyday metadata operations.
Independent read dispatch and journal fingerprint locks
The mounted-read cohort is independent of the metadata cohort above. Every candidate read probe in every condition finishes before copying in 30/30 samples, versus 0/30 for baseline.
| Journal condition | Operation | Baseline ms | Candidate ms | Median change and 95% CI |
|---|---|---|---|---|
| nojournal | Read-only OPEN during copying | 784.602 | 1.577 | -99.799% [-99.817%, -99.782%] |
| nojournal | Held-fd READ during copying, 64 KiB | 784.597 | 0.521 | -99.934% [-99.936%, -99.927%] |
| nojournal | OPENDIR and 64-entry enumeration during copying | 791.558 | 6.919 | -99.126% [-99.190%, -99.074%] |
| legacy | Read-only OPEN during copying | 797.214 | 3.172 | -99.602% [-99.612%, -99.579%] |
| legacy | Held-fd READ during copying, 64 KiB | 797.424 | 0.960 | -99.880% [-99.909%, -99.860%] |
| legacy | OPENDIR and 64-entry enumeration during copying | 804.033 | 10.292 | -98.720% [-98.758%, -98.695%] |
| compact | Read-only OPEN during copying | 800.275 (25/30); 2340.599 (5/30) | 2.219 | Separated; no single ranking |
| compact | Held-fd READ during copying, 64 KiB | 800.486 (25/30); 2340.717 (5/30) | 0.760 | Separated; no single ranking |
| compact | OPENDIR and 64-entry enumeration during copying | 807.137 (25/30); 2347.782 (5/30) | 9.737 | Separated; no single ranking |
Compact baseline reads separate into 25/30 ordinary and 5/30 slow samples; both clusters remain without a single speedup percentage. OPEN measures opening only; complete open/read/close is separate in the local CSV and includes FSKit parent xattr queries and read-only close callbacks.
The native journal cohort measures observe_read for 64 unrelated paths, also recording hash completion. Read observations retain their non-durable-per-read policy, with final sync_preimages outside timing.
| Journal condition | Operation | Baseline ms | Candidate ms | Median change and 95% CI |
|---|---|---|---|---|
| legacy | First unrelated read observation | 462.276 | 0.184 | -99.960% [-99.964%, -99.956%] |
| legacy | 64-path read observations | 473.262 | 12.011 | -97.462% [-97.521%, -97.384%] |
| legacy | Complete 1 GiB fingerprint | 462.230 | 469.558 | +1.585% [+0.621%, +1.964%] |
| compact | First unrelated read observation | 450.714 | 0.045 (25/30); 0.071 (5/30) | Separated; no single ranking |
| compact | 64-path read observations | 453.158 | 2.385 | -99.474% [-99.477%, -99.464%] |
| compact | Complete 1 GiB fingerprint | 450.739 | 452.237 | +0.332% [-0.398%, +0.783%]; no detected difference |
Legacy's 64-path observation waiting falls substantially, while its full hash increases by 7.329 ms, absolute 95% CI [+2.894, +9.066] ms. Compact hashing detects no difference. All idle probes in the read cohort and idle observations in the journal cohort detect no difference, which does not prove equal overhead. Compact writable-open median falls by 1.89%, 95% CI [−3.13%, −0.45%]; other conditions detect no difference. This measures open completion under concurrent probes, not independent storage bandwidth.
Long-operation tails remain uncertain: the read cohort's no-journal writable-open reference P95 moves from 952.6 to 3166.9 ms, with maxima 1469.6/4636.8 ms; all slow samples remain. Normal read/write I/O, directory snapshots and publication can still occupy the shared state lock. Independent queues do not guarantee arrival order for overlapping reads and mutations, and concurrent first observations can duplicate fingerprint work. Short-request improvements do not establish that complete Agent tasks or long operations never regress.
Parallel stage synchronization: measurement status
PVISOR_STAGE_SYNC_WORKERS=2|4|8 opts into a bounded regular-file synchronization pool during stage sealing; unset or 1 retains serial execution. Journal validation and persistence finish first. Every file synchronization must succeed and every worker join before bottom-up directory synchronization, parent persistence and atomic seal publication; failure publishes no new seal. Explicit workload fsync and journal synchronization do not use this pool.
No independent serial/parallel timing data is available. The A/B above does not change worker counts and cannot quantify this option's gains. Evaluation requires one frozen binary, fresh stages and otherwise identical configurations, timing through complete persistence and verifying unchanged lowers, complete upper bytes and completion markers. Implementation availability does not establish a speedup magnitude.
Derived data, sources and reproduction
The copy-up, read-dispatch and journal-lock statistics CSVs remain in the corresponding local batches or archives. They directly copy committed derived results, retaining cohorts, sample counts, distributions, relative/absolute intervals and raw-report digests; artifact digests and source receipts are in the source reports. Complete idle controls, reference tails and extrema remain in the CSVs.
Sources: copy-up engineering report, read-dispatch and journal-lock engineering report. Raw logs, sources and artifacts remain in the measurement workspace's benchmark/pvisor/.data/host-copy-up-*, .data/read-* and .data/journal-*, without site downloads. Reproduce using the host copy-up manual and read-dispatch/journal-lock manual. macOS/macFUSE is required; Linux harness tests cannot replace mounted measurements.
Current Linux HOST kernel caching and evidence
Under an explicit ownership contract, the Linux HOST API supports writable Metadata and read-only MetadataAndData; current-source correctness tests and independent request counters are valid, while formal performance acceptance remains blocked. Kernel caching and the service-side immutable-lower physical metadata cache below are separate mechanisms. Neither automatically changes product executor defaults.
Policies and admission contract
pvisor_overlayfs::api::OverlayMountConfig.kernel_cache explicitly selects the policy. Default behavior remains unchanged; no environment variable automatically enables extended policies.
| Policy | Entry/attr TTL | Negative TTL | Regular-file opens and scope |
|---|---|---|---|
Disabled (default) |
Legacy 1 second | 0 | No KEEP_CACHE; preserves the old default |
Uncached |
0 | 0 | No KEEP_CACHE; explicit metadata-cache-off control |
Metadata |
Configured, 0 < TTL <= 60s |
Same configured value | No KEEP_CACHE; supports writable Linux HOST views |
MetadataAndData |
Configured, 0 < TTL <= 60s |
Same configured value | KEEP_CACHE only for stable read-only regular files; writable configurations explicitly rejected |
Configured TTL defaults to 60 seconds and is ignored by Disabled/Uncached. Uncached does not enable DIRECT_IO: normal kernel page caching within an open handle remains. No policy enables writeback caching.
Extended policies require every physical lower explicitly declared Immutable in order, both OwnedViewContract assertions affirmed, explicit StableView read semantics, default_permissions and owner-only FUSE access. Contents, namespace, permissions, ownership, xattrs, hardlink aliases, physical ancestors and mount identities must remain stable. Only this adapter may mutate upper/work, which remain exclusive until actual detachment. Reads must not change backing atime: merged-mount NoAtime does not replace real backing noatime or an equivalent guarantee. A read-only mount, image digest or advisory lock does not prove these conditions. The adapter retains nonblocking exclusive flock locks on canonical upper/work directory objects; they coordinate cooperating opt-in sessions only, not out-of-band host writers.
Admission rejects journals/preimages, compact journal initialization, read metrics sinks, all custom path policies (including bound contexts) and exclusions before preparation I/O, without downgrading or silently skipping observations. StableView accepts that cache hits bypass callbacks; it provides no per-read audit, first-content-observation journal, snapshot or review compatibility. macOS and VM do not support extended policies. Virtio-fs lacks an equivalent verified notification output transport, and this DTO is not propagated into runtime/VM configuration.
Mutation effects and failure boundaries
Precise effects are collected before and after mutations, including requests that fail after partial copy-up or upper modification. Effects cover known object inodes, hardlink aliases, parent/ancestor attributes and exact namespace entries. Rename/exchange/removal include known subtrees, replaced objects and old/new entries; parent attribute changes do not expand into unrelated sibling-entry eviction. Covered operations include create/mknod/mkdir/symlink, unlink/rmdir, rename/exchange, link, writable open/copy-up/O_TRUNC, write, setattr, xattrs, fallocate and copy_file_range.
Copy-up and recursive directory materialization bind new physical objects back to existing FUSE identities. Late-discovered lower hardlink aliases obtain current upper identity and attributes from the Core owner-session copied_hard_link_metadata mapping. It survives adapter FORGET/reclaim; lookup/readdirplus materialize upper aliases when needed and record effects. The mapping belongs only to the current Core owner/session and is not persisted across rebuilds, reconstruction or new sessions. Adapter inode tables or canonical paths cannot replace it.
Pending is incremented before mutation, temporarily forcing zero TTL on metadata/entry replies, including mutation replies. An independent reply worker performs metadata-only inval_inode(ino, -1, 0) on affected inodes before replying; Linux cooperative mutation handling updates direct dentry/page-cache state. A separate entry worker asynchronously sends additional inval_entry(parent, name) notifications and expires attributes again. Long TTLs resume only after all batches complete. Entry notifications need not precede syscall completion. The reply worker never waits for the entry worker; FUSE callbacks do not wait for workers, notify the kernel or detach mounts. Writable inodes receive no blanket data invalidation that could wait on dirty pages/related writes; Metadata uses no KEEP_CACHE.
WRITE uses each request's current open flags, honoring dynamic clearing/restoring of O_APPEND. COPY_FILE_RANGE clears stale backing-fd O_APPEND before positional copying, without requiring an intervening WRITE. Errors after partial copying return the written byte count so the kernel learns about actual modifications.
Reply/entry queues each hold at most 256 batches, the stop queue 513 items, and global reservations at most 512 mutation batches. Each effects plan holds at most 4096 inode/entry keys plus one overflow sentinel. Overflow, worker panic or notification errors (except harmless ENOENT) stop the session; upper modifications are not rolled back. Writable admission requires the real fusectl abort endpoint and a disposable mount at the actual mountpoint verifying detach→abort. Users must not start before mount() returns.
Failure workers detach and verify mountinfo before writing connection abort; failed detach prevents the abort write. Helpers, termination, worker joins and shutdown have bounded waits, with a 15-second outer shutdown deadline; fatal termination failure ends the server process. Individual notifier calls have no independent deadline; termination limits do not guarantee that every mutation syscall completes within those limits. Abort/server death cannot revoke other processes' warm caches, and successful detachment cannot revoke held fds. EIO is not a general detachment fence. Callers must supervise and stop every user, release fds, retain backing for recovery, prohibit exported bind/namespace/FD aliases, and preserve namespace, credentials, helpers and detach permissions. Experiment failure evidence includes FUSE tasks waiting in request_wait_answer after namespace kill; simple-process termination probes do not establish immediate bounded cleanup for every FUSE wait.
Current validation and measurement scope
Targeted validation records on 2026-10-07 report 58 passed / 9 skipped for pvisor-overlayfs and 124 passed / 5 skipped for pvisor-overlay-core, plus 7 passed explicitly executed real-mount tests. Regressions cover late-hardlink identity after inode reclamation, dynamic APPEND with positional copy, and partial-copy failures. Independent source review found no new blocking issues in these identity and copy fixes. The validation scope does not include a comprehensive audit or performance acceptance.
B-FS-ENG plans a same newly frozen release-binary comparison of native, legacy-writable, Metadata-writable60s, Metadata-readonly60s and MetadataAndData-readonly60s: 3 warmups and 30 samples/cell, CPUs 0,1, seed 4207, 2048 byte-verified files in 32 half-deep branches. Writable comparisons hold view semantics fixed; KEEP_CACHE attribution compares only the two read-only conditions. Hot/readsearch/TTL operations have immediate priming. The TTL window waits 1.1 seconds outside timing and does not test 60-second expiry.
All native/lower/upper/work inputs reside on genuine noatime,nosuid,nodev,mode=0700,size=512m tmpfs in a private user/mount/PID namespace. Live mountinfo/device proofs and repeated physical file/directory reads with past atime cover backing including upper/work and establish unchanged atime. Merged NoAtime or future atime alone is not physical proof. RAM-backed evidence does not establish disk-backed performance/durability, VM, pvisor run or review guarantees.
| Evidence | Current-source status |
|---|---|
| Five-condition preflight, n=1/cell | Passed |
| Formal timing, 3 warmups + 30 samples/cell | All three whole cohorts contaminated by concurrent Cargo checks and rejected; accepted=0 |
| P50, time changes and bootstrap 95% CI | Unaccepted; statistics remain empty in all 25 planned cells |
| Independent B-FS-DIAG profile, n=3/case | Valid for request counters only |
The independent profile retains 90 fresh diagnostic cases, 5 persistent correctness processes, 95 logs and 152 unique final instances. Each instance's final cumulative record replaces earlier checkpoints rather than being summed. The table extracts request medians from the derived CSV for three diagnostics per condition; all ranges equal the medians. Warm deltas subtract the independently fresh-mounted prime-only case in the same round. Units are callbacks, with no timing values.
| Operation / counting scope | Condition | LOOKUP | GETATTR | OPEN | READ |
|---|---|---|---|---|---|
| Hot / warm delta | legacy-writable | 0 | 4096 | 4096 | 4096 |
| Hot / warm delta | metadata-writable | 0 | 4096 | 4096 | 4096 |
| Hot / warm delta | metadata-readonly | 0 | 0 | 4096 | 4096 |
| Hot / warm delta | metadata-and-data-readonly | 0 | 0 | 4096 | 0 |
| TTL window / warm delta | legacy-writable | 2192 | 2049 | 4096 | 4096 |
| TTL window / warm delta | metadata-writable | 0 | 4096 | 4096 | 4096 |
| Readsearch / warm delta | metadata-readonly | 0 | 0 | 2048 | 2048 |
| Readsearch / warm delta | metadata-and-data-readonly | 0 | 0 | 2048 | 0 |
| Hot / complete fresh-mount lifecycle | metadata-and-data-readonly | 2192 | 1 | 8192 | 2048 |
Counts support extended TTL avoiding repeated LOOKUP in this window and read-only KEEP_CACHE eliminating warm-operation READ callbacks. Writable Metadata does not eliminate GETATTR/OPEN/READ. The full lifecycle still includes initial reads; zero warm READ does not mean no physical reads or zero task cost. Diagnostic elapsed times do not enter formal distributions, rejected batches are not pooled, and earlier-source noatime performance cannot substitute for current-source acceptance. The separate valid immutable-cache results below retain their original measurement scope.
Formal acceptance status and independent request-counter CSVs remain in the local batch or archive; see the engineering report · Reproduction and evidence contract. Both CSVs are directly copied derived data retaining source/binary digests and statistical scope. Raw samples, logs, frozen sources and receipts stay in benchmark/pvisor/.data/, without site publication or rewriting historical results.
Physical metadata caching for immutable lowers
Same-artifact real Linux FUSE A/B reduced read-heavy median operation time by roughly 24–26%, and fresh-process/mount/tool-through-unmount task time by 19.6%. This is B-FS-ENG engineering evidence, not an order-of-magnitude improvement or proof of equal gains for OCI, VM, full Agent tasks or staged execution with review journals.
Contract and experiment design
Each lower declares LayerMutability::{Mutable,Immutable}, defaulting to mutable. The caller guarantees lifetime stability of contents, metadata, namespace, parent and mount identity, including hardlink aliases. The cache retains successful physical-lower metadata only, bounded to 4096 entries. Upper, higher-priority mutable layers, whiteout/opaque, access policy and first observations remain checked. The kernel's one-second TTL, KEEP_CACHE and read-observation semantics are unchanged.
OCI extraction directories remain host-writable and lazy-image physical projections change on demand, so neither source is automatically promoted. Host rootfs, arbitrary directories and frozen baselines also receive no automatic promise. The experiment uses an exclusively owned, actually stable lower; a read-only mount is not a substitute for ownership.
Measured 2026-10-07 on Ryzen 7 9700X, Linux x86_64 and Btrfs, with driver/tools pinned to CPUs 0,1. Inputs have 2048 files in 32 branches, half deeply nested, totaling about 1.1 MB; host cache is warm. Native, mutable FUSE and immutable cache-off/on use one frozen release driver. Three warmups and 30 measured samples per cell are seeded-shuffled, totaling 600 measured samples with no formal failures. Both immutable arms keep identical declarations, changing only the service cache. No preimage journal is enabled, excluding review/apply cost.
Data and analysis
Milliseconds, P50; changes are relative to same-contract cache-off, with paired-round bootstrap 95% intervals.
| Workload | Native | Mutable FUSE | Cache-off | Cache-on | Time change | 95% interval |
|---|---|---|---|---|---|---|
| Hot metadata/open/read, two passes | 9.34 | 140.01 | 140.86 | 103.96 | −26.20% | [−26.55%, −25.79%] |
| Two passes after TTL expiry | 13.56 | 150.56 | 147.71 | 112.47 | −23.86% | [−25.44%, −22.44%] |
| One open/read/search verification pass | 3.36 | 69.72 | 70.31 | 52.80 | −24.90% | [−25.48%, −24.22%] |
| Git status, rg and content checks on persistent mount | 19.81 | 202.21 | 203.43 | 154.55 | −24.03% | [−24.69%, −22.98%] |
| Fresh process, mount, tools and unmount | 22.66 | 210.76 | 210.49 | 169.28 | −19.58% | [−20.44%, −19.10%] |
Hot traversal has untimed priming. TTL conditions wait 1.1 seconds after priming outside the timer; the second pass may hit kernel cache, so this is not fully cold reading. Writes are correctness probes only, without write-performance claims. All reads verify complete bytes. Append-preserving copy-up, rename, unlink/recreate, whiteout, immediate/after-TTL visibility and exact upper inventories pass; complete lower content, namespace and metadata inventories are unchanged. Inputs do not trigger eviction. Large repositories, concurrency, macOS and guest paths remain unmeasured.
An independent profile has 24 instances, all with final records; instrumentation is excluded from timing. Persistent cache-on reduces physical parent-stat counts by 49.2% and leaf-stat counts by 84.3% versus off, with equal open/read counts. This supports less repeated server resolution, not proof of eliminating all FUSE requests or physical disk reads; inclusive spans are not summed. Cache-on remains substantially slower than native. Long kernel caching, upper consistency and mapping/fault paths need separate validation.
Formal statistics and all-instance counter CSVs remain in the local batch or archive; see the engineering report and reproduction. Frozen sources, build receipts, input inventories, failed preflight, formal samples and independent profiles stay in benchmark/.data/immutable-cache-*, separate from user performance distributions.
Independent counters for pinned artifacts
Measured on 2026-10-06, CPUs 0,1, VM 2 vCPU/16 GiB, with verified frozen CLI, source, tool inputs and firmware. Seven-tool and fixed-repair workloads each run three times in staged/VM modes: twelve valid jobs, zero failures. Complete shared-input byte inventories are identical before and after. Executor-provided TMPDIR is preserved, with a fresh private empty tool cache per task; seven-operation Cargo temporary files and outputs remain in each independent workspace. Diagnostic stderr goes directly to a regular file, avoiding EAGAIN from nonblocking pipes during large profile writes. Profiles and startup timing are enabled; these times do not enter user performance distributions.
Every staged trial has 5/5 final instances, every VM 13/13, totaling 108 across rootfs, workspace and supervisor. Records use PID, component and instance, retaining only each instance's last cumulative snapshot. Frozen source construction order establishes rootfs/workspace scope; matching instance numbers in supervisor and VMM cannot be pooled. Inclusive spans nest and overlap across workers, so they cannot be summed into total runtime or a bottleneck percentage.
| Workload / mode | Filesystem | Metric | Median calls | Median inclusive ms |
|---|---|---|---|---|
| Seven tools / staged | workspace | OverlayCore resolve | 14,978 | 144.67 |
| Seven tools / staged | workspace | OverlayCore observe_read | 4,853 | 162.74 |
| Seven tools / staged | workspace | OverlayCore fingerprint_content | 2,157 | 43.26 |
| Seven tools / staged | workspace | journal sync | 5 | 3.07 |
| Seven tools / VM | workspace | OverlayCore resolve | 15,146 | 234.64 |
| Seven tools / VM | workspace | OverlayCore observe_read | 4,840 | 224.98 |
| Seven tools / VM | workspace | OverlayCore fingerprint_content | 2,157 | 64.13 |
| Seven tools / VM | workspace | journal sync | 5 | 2.12 |
| Seven tools / VM | rootfs | OverlayCore resolve | 6,790 | 184.66 |
| Seven tools / VM | rootfs | virtio-fs LOOKUP | 4,802 | 166.51 |
| Seven tools / VM | rootfs | virtio-fs READ | 6,132 | 643.31 |
| Repair / staged | workspace | OverlayCore resolve | 3,126 | 29.45 |
| Repair / VM | workspace | OverlayCore resolve | 2,858 | 39.80 |
| Repair / VM | rootfs | OverlayCore resolve | 6,672 | 180.76 |
Seven-tool VM dispatch/admission records 1,260.54 ms for rootfs and 898.64 ms for workspace. It surrounds all of service_queues, including inline execution, and is not pure queueing or transport. Corresponding pool_queue_wait spans are 13.62 ms and 4.09 ms; waits from different workers still cannot be summed into task time.
Median fingerprint_bytes is 69,375,893 B for seven tools and 11,286 B for fixed repair, identical in staged/VM modes. The source hashes live-lower content on its first observation; ordinary stat/lookup does not hash regular files, and a frozen baseline skips read journaling. Checkpoint durability moves journal persistence to completion. The current seven-tool workspace journal syncs five times, with roughly 2–3 ms in the displayed sync spans; these counts do not establish per-file preimage fsync as the current dominant cost. This mutable fixture does not validate content-receipt reuse or replace read fingerprints with metadata-only observations.
All six VM diagnostics have zero rootfs CREATE, RENAME and WRITE requests with default scratch, supported by complete final records. Rootfs READ still totals roughly six thousand requests; its spans include service, locking and scheduling and cannot be read as disk or transport wait. Investigate path resolution, read observation, tool loading and cache writes separately. Repair reads hash little data but still incur rootfs resolution; the execution-mapping probe establishes only a short-process mapping-path difference. DAX, long attribute caching and individual functions' causal gains remain unverified, requiring engineering A/B that preserves access/staging semantics and independent formal timing.
The local derived counter CSV retains three-run statistics and call ranges per filesystem scope, complete coverage and source digests. Original logs, frozen harness, build receipts and the summary script stay in local .data/. An earlier pipe-captured diagnostic with the same binary had five VM aborts from stderr EAGAIN printing panics; failed evidence is retained and excluded from this table. Regular-file capture is diagnostic only, and differences between capture conditions do not establish performance gains; see the counter manual.
Rootfs requests from the npm compile cache
The seven-tool workload's 537 rootfs renames come from Node/npm compile-cache creation. Linux, CPUs 0,1, guest 2 vCPU/16 GiB; the same frozen CLI, tool inputs and firmware alternate default and disabled caches in seeded randomized order. npm --version and the complete seven-tool workload each use six independent fresh VMs, three per condition: twelve successful VMs with 156 final filesystem instances. Both arms include the same Node status probe and subsequent cache inventory. Profiling and strace are enabled; no formal latency or performance gain is reported.
The table gives median counts across three VMs per condition. Every displayed count has the same minimum, median and maximum. Rootfs and workspace remain separate, identified by PID, component and instance; matching instance numbers in the supervisor and VMM must not be pooled.
| Workload | Node compile cache | Actual cache files | Rootfs CREATE | Rootfs RENAME | Rootfs WRITE |
|---|---|---|---|---|---|
| npm --version | Default enabled | 70 | 70 | 70 | 70 |
| npm --version | Disabled | 0 | 0 | 0 | 0 |
| Seven tools | Default enabled | 537 | 538 | 537 | 623 |
| Seven tools | Disabled | 0 | 1 | 0 | 86 |
The Node API confirms /tmp/node-compile-cache in the default arm and DISABLED in the other. Successful strace renames use the VM's root-upper/tmp/node-compile-cache paths, with counts matching rootfs RENAME, copy-up and actual cache files. Complete-tool outputs, every byte of all 256 written files, unchanged lower inventories and execution records pass validation; shared inputs are identical before and after. Disabling caching is a request-attribution control, not a product optimization or user configuration recommendation. The 537 requests cannot be converted into a verified millisecond gain.
Independent filesystem counters need to cover tool caches as well as workspace writes. Formal comparisons must declare whether caches persist between tasks, whether they start empty and which storage they use. Warm page caches and Node compile caches are separate conditions. Two npm calls within one task may reuse their cache; different backends and tasks must not accidentally share one. An empty private cache in workspace storage is a controlled policy, not a measurement of every executor's default temporary storage.
The local derived cache-request CSV gives sample counts, count ranges, final coverage and binary, source, input, tracer and raw-report digests. Original syscalls, status output and audit scripts stay in local .data/, separate from user task latencies.
A separate diagnostic preserving pVisor's default temporary directory uses six fresh VMs, three per condition, with final records for all 78 filesystem instances. Guest statfs returns 0x01021994, confirming actual tmpfs. The enabled arm still creates 537 cache files every time, with zero rootfs CREATE, RENAME and WRITE requests. The disabled arm also has zero of those requests and zero cache files. Complete-tool outputs and written bytes pass validation. This establishes that cache creation can stay in default tmpfs. The older workload's tools_env() replaced the executor-provided TMPDIR with /tmp, moving cache writes into the rootfs overlay. These small instrumented diagnostics do not establish an end-to-end speedup; default temporary storage and the workspace-storage control need separate formal sampling.
The local default-temporary-storage request CSV retains independent samples and provenance, without pooling them with the /tmp diagnostic.
FUSE requests and staging service costs
Four host conditions use the same verified pinned CLI and seven-tool inputs: native, direct host, a separately rebuilt passthrough FUSE driver and staged. Four preflights and three randomly interleaved rounds pass, totaling sixteen tasks. Every task's 256 written files are checked byte-for-byte; staged lower paths, modes and contents remain unchanged. Direct execution may rewrite only the fixture's verified toolchain path and refresh Git index stat information, with all indexed paths, modes and object IDs unchanged. Fresh caches preserve executor TMPDIR.
The driver uses the same frozen vendored fuser bytes, release profile, synchronous request loop and one-second TTL, without writeback or keep_cache. It omits OverlayCore, access policy, copy-up and preimage logging, so it is a transport-control lower bound. The following are request-count medians across three independent profiled tasks, excluding preflights:
| Workspace request | Passthrough FUSE | Staged host FUSE |
|---|---|---|
| lookup | 3,059 | 3,057 |
| getattr | 452 | 451 |
| read | 5,014 | 5,014 |
| write | 290 | 290 |
| readdir | 464 | 465 |
These five measured callback classes have similar counts. Staged adds internal service work: 14,975 OverlayCore resolves with a median inclusive span of 143.52 ms, 4,853 read observations with 164.30 ms, and 2,157 content fingerprints with 45.15 ms. They nest and overlap, so they cannot be added or assigned percentages of task time. This supports testing resolution and read-observation costs separately from kernel request traffic. It does not show the passthrough driver offers equivalent semantics or establish a product speedup.
Derived FUSE request and service counters retain count ranges, component/instance scope and CLI, driver, source, input and audit digests. Instrumentation and sampled resource observations prevent these task times from entering user latency tables; unknown process lifetimes remain unknown. Raw evidence stays in .data/; reproduction is documented in the benchmark README.
Stage durability counters
A separate batch uses the same verified CLI and tool inputs with native, strict and checkpoint conditions. Three preflights and three randomized rounds pass, totaling twelve tasks. All staged tasks have the requested policy marker and completed seal, unchanged lower inventories, complete written bytes and five final filesystem instances. The table gives per-task medians across three independent profiled trials; it is not pooled with the FUSE-control batch.
| Journal operation | strict calls | checkpoint calls | strict inclusive ms | checkpoint inclusive ms |
|---|---|---|---|---|
| append | 2,703 | 2,703 | 8.78 | 5.97 |
| transaction | 8,686 | 8,686 | 329.44 | 18.53 |
| sync | 340 | 5 | 313.08 | 3.23 |
On Linux each logged sync span invokes the journal file's sync_all; other directory/file synchronization is outside this counter. Strict has 339–340 such calls per task, checkpoint exactly five. The transaction span includes synchronization, so its time cannot be added to the sync span. This identifies persistence as a substantial strict-mode service cost. Checkpoint still records the same 2,703 appends and checks the completion seal; it permits an unsynced log before completion. These checks do not establish arbitrary crash-window equivalence, and profiled spans do not prove the same reduction in uninstrumented task latency. The engineering runner retains separate timing cohorts, distribution splits and paired intervals for at least thirty rounds.
Derived durability counters include all component instances, count ranges and source/input/audit digests. Raw reports, original stdout/stderr, output inventories and failed publication-audit attempts stay locally under .data/.
Independent executable-mapping diagnostic
Identical ELF, loader and all dynamic-library bytes for rg --version execute through virtio-fs files or executable memfds. Linux, inherited host affinity 0,1, guest configured with 2 vCPU/1 GiB; each condition uses three independent fresh VMs with 50 calls per VM, in randomized interleaved order. All twelve VMs and 600 calls pass output checks; every VM has final records for all 13 filesystem instances. The complete prepared input inventory passes verification before and after execution; retained workspace paths, copy bytes, commands, output and profiles pass an independent audit. Profile stderr is captured directly into a regular file. Build, input, firmware and raw-output digests stay in evidence. These profiled diagnostic runs do not enter user task-performance tables or establish complete descendant lifetime CPU placement.
| Preparation source | Execution mapping | First-exec median ms | Repeated-exec median ms | Repeated-exec major faults |
|---|---|---|---|---|
| Original files | virtio-fs | 6.48 | 5.10 | 37 |
| Original files | memfd | 1.56 | 0.73 | 0 |
| Independent-inode copies | virtio-fs | 7.93 | 5.07 | 37 |
| Independent-inode copies | memfd | 1.27 | 0.73 | 0 |
First-exec statistics use the first call in each of three VMs. Repeated-exec statistics take each VM's median over its remaining 49 calls, then the median across three VMs; calls are not independent samples. Both arms copy and hash-check identical inputs and inherit the same fds; guest /dev/shm remains noexec. Original preparation prewarms original inodes; duplicate preparation reads identical bytes from separate inodes. Common Python preparation still warms its interpreter and some libraries, so this is not completely cold startup.
The repeated-exec mapping gap is about 4.4 ms, accompanied by major faults changing from 37 to zero. This supports investigating executable mapping and fault service first. Major faults do not equal physical disk reads. The substitution changes file mapping, path access and loader request paths together; it cannot attribute the whole gap to FUSE transport or missing DAX, or extrapolate gains by multiplying a complete Agent task's process count. Production changes need to preserve access policy, staging observations and evidence semantics before independent formal timing.
Execution statistics, provenance and measurement-boundary CSVs, raw reports, per-VM output, audit and the publication script stay in local benchmark/.data/.
Apply planning and target durability
CLI-only release builds share a frozen parent source; only the apply implementation differs in executed code. The compiler and features, profiles and rustflags of all 292 dependency compilation units match. CPUs 0,1, warm host caches, three warmups and 30 formal measurements per cell, randomized alternating order, independent target/stage per run; preparation is outside the apply timer. These 240 valid samples have profiling and strace disabled; changed files share one directory.
| Files | Operation | Baseline P50 ms | Directory-index P50 ms | Paired-bootstrap 95% difference interval ms |
|---|---|---|---|---|
| 1,000 | Apply | 962.12 | 944.09 | −51.16 to −2.72 |
| 1,000 | Conflict before apply | 46.07 | 21.98 | −24.75 to −22.98 |
| 10,000 | Apply | 13,130.25 | 11,031.86 | −2,461.98 to −1,790.97 |
| 10,000 | Conflict before apply | 2,651.01 | 189.78 | −2,474.89 to −2,448.60 |
The frozen harness checks complete original, staged and final contents at runtime, then deletes generated workspace/upper files. Independent post-run checks cover retained builds, commands, exit codes, conflict output and committed ledgers; they do not independently recheck deleted final files. Conflict before apply does not test concurrent external writes during apply or crash recovery. This engineering A/B is not a comparison against Git or other products.
A separate profile/strace diagnostic has three trials per cell and 24 valid commands, retaining complete exit records and classifying calls by fd paths. Both variants have identical synchronization counts:
| Files applied | Target-file fsync | Target-directory fsync | Stage fsync | Other fsync | Total |
|---|---|---|---|---|---|
| 1,000 | 1,000 | 1,003 | 18 | 1 | 2,022 |
| 10,000 | 10,000 | 10,003 | 18 | 1 | 20,022 |
All these calls are zero for conflict-before-apply commands. The directory index improves planning without reducing target-durability calls; applying 10,000 files still takes about 11 seconds. Batching synchronization per unique directory at transaction boundaries merits a separate experiment, after verifying Prepared, TargetApplied and Committed durability ordering, crash recovery and concurrent external-edit protection. Counts establish call volume, not its share of all remaining time. Tracing perturbs durations; they cannot be added to nested profile spans or used in the formal benefit table.
Formal statistics, paired differences, synchronization counts, provenance and audit-scope CSVs, raw records and publication scripts stay in local benchmark/.data/.
Retained independent engineering experiments
The new default-release local VM completes at P50 4.15 s (+3.3% versus optimized v3), with traversal at 157.57 ms (-6.5%). Warm lazy-image open/read improves 8.6% and 64 MiB reads improve 6.6%, but traversal slows and copy-up takes about 2.5× as long. This batch shows no general end-to-end acceleration; see the new-version evaluation for complete distributions and cache conditions.
Motivation
Agents repeatedly list, search and modify files. Tool time and full job time together show the cost of choosing staging or a VM.
Experiment design
The latest batch randomizes native and both versions of staged and libkrun VM. Historical matrices also include host, safe, Docker, rootless Podman/crun and pVisor OCI. Cells usually have 3 warmups and 30 measurements with warm host caches; the complete Ubuntu follow-up uses N=10, labeled separately. Image/input preparation is excluded. Worker time includes tool execution and validation; wall time includes launch and teardown. metadata/git/rg use 2,048 files in 32 directories; read validates a 64 MiB hash. product-v1 and the complete tool environment both write 256×64 KiB files, totaling 16 MiB; each cohort remains separate by configuration. cargo builds 64 dependency-free modules and verifies 2016. npm installs 32 local packages offline, without registry access.
macOS
This round was measured on Linux only; for the platform coverage boundary and where existing macOS/HVF results live, see the end-to-end task analysis.
Linux: evaluation after the shared filesystem service refactor
The frozen new source retains host FUSE while local, staged and lazy VM views enter the shared service through virtio-fs. Lazy images no longer create an intermediate host FUSE mount. The implementation still keeps protocol state in the two adapters; DAX, writeback and long attribute TTLs remain disabled.
Comparison and measurement scope
The baseline is the final optimized v3 artifact from the earlier five-item campaign, including path indexing, lazy directory allocation and queue changes; it is not a pre-P0 version. The new integrated worktree was frozen before building, with source and executable hashes recorded. Concurrent cluster/service changes are also present, so this is a version-artifact comparison, not an attribution to one function or solely to removing FUSE.
Both artifacts use identical firmware and complete tool fixtures, 2 vCPU/4 GiB and physical cores 0,1. Both staged variants must report rootless_process with read/write isolation. Each cell has one correctness preflight, three warmups and 30 measurements; preflight and warmups are excluded. Five cells shuffle each round and seven tools run in their fixed order. These workloads use local rootfs, which already had no intermediate host FUSE, making a separate lazy-image measurement necessary. Host caches are warm and CPUs are not exclusive. Release one-minute host load is 1.37 → 2.27; independent batches are not pooled.
Default release: complete local-rootfs workloads
P50 values below are milliseconds; negative changes mean less time. All 150 jobs and 1,050 tool measurements passed existing output, Run Bundle, untouched-lower and complete 256-file upper checks. Both release artifacts use the same size-oriented opt-level=z build.
| Operation | Native | Host staged before → after | VM before → after | VM change |
|---|---|---|---|---|
| metadata | 4.58 | 76.14 → 76.29 | 168.53 → 157.57 | -6.5% |
| read | 32.21 | 65.65 → 66.18 | 116.12 → 116.91 | +0.7% |
| write | 3.60 | 200.70 → 200.46 | 245.18 → 243.09 | -0.9% |
| git | 13.79 | 165.87 → 165.75 | 359.63 → 439.83 | +22.3% |
| rg | 6.84 | 89.95 → 90.46 | 448.42 → 448.88 | +0.1% |
| cargo | 46.49 | 102.49 → 102.65 | 488.15 → 494.97 | +1.4% |
| npm | 163.74 | 250.12 → 250.71 | 1337.35 → 1334.66 | -0.2% |
| Launch to exit | 426.43 | 1240.79 → 1242.06 | 4021.54 → 4152.52 | +3.3% |
New VM traversal P50 decreases 6.5%, but completion increases 3.3% and Git increases 22.3%. Host staged completion changes only +0.1%. This batch does not show general local-rootfs acceleration. Relative to its native control, the new VM takes approximately 34.4× for traversal, 67.5× for small-file writes, 3.6× for 64 MiB reads and 8.2× for npm. Small-file and metadata costs remain substantial.
| Operation | VM before → after P95 | VM before → after P99 |
|---|---|---|
| metadata | 199.59 → 199.24 | 208.31 → 201.96 |
| read | 120.75 → 134.33 | 123.49 → 141.60 |
| write | 260.44 → 269.16 | 262.67 → 272.02 |
| git | 719.48 → 723.31 | 738.35 → 746.02 |
| Launch to exit | 4384.50 → 4406.12 | 4550.35 → 4469.82 |
Traversal tails decrease slightly, while read/write tails increase. Completion
P95 is close and P99 decreases slightly. With 30 samples P99 is sensitive to
individual jobs; median or isolated tail changes do not establish stable gains.
The Local raw record docs/src/assets/benchmarks/.data/filesystem-service-20261005/local-release.tsv
retains all seven worker timings and launch-to-exit time for every job.
Performance artifacts: local comparison with matched build settings
A separate complete batch has 150 jobs and 1,050 tool measurements, all passing correctness and isolation checks. Baseline and new versions both use opt-level=3. Host load is 0.93 → 3.87 and CPUs are not exclusive. Values are P50 milliseconds. Distributions are not pooled with release, and the new 4.15/3.81 s across those batches is not a causal build-optimization measurement.
| Operation | Native | Host staged before → after | VM before → after | VM change |
|---|---|---|---|---|
| metadata | 4.59 | 67.30 → 67.91 | 146.11 → 148.54 | +1.7% |
| read | 32.12 | 65.60 → 65.41 | 116.28 → 115.21 | -0.9% |
| write | 3.68 | 196.60 → 195.74 | 233.49 → 231.45 | -0.9% |
| git | 14.12 | 156.56 → 155.28 | 345.22 → 331.88 | -3.9% |
| rg | 6.99 | 80.93 → 81.58 | 389.81 → 394.48 | +1.2% |
| cargo | 47.14 | 103.71 → 101.63 | 459.17 → 460.00 | +0.2% |
| npm | 166.44 | 254.44 → 252.32 | 1236.33 → 1237.97 | +0.1% |
| Launch to exit | 430.56 | 1187.74 → 1186.28 | 3860.30 → 3809.40 | -1.3% |
New VM completion changes -1.3%, Git -3.9% and metadata +1.7%, with smaller median changes elsewhere; host staged completion changes -0.1%. Release completion +3.3% versus this batch's -1.3% is inconsistent with general acceleration. Current performance VM traversal is about 32.4× its same-batch native control, small-file writes 62.8×, reads 3.6× and npm 7.4×. The new performance binary is 19.38 MiB, versus release 14.99 MiB, approximately 29.3% larger.
| Operation | VM before → after P95 | VM before → after P99 |
|---|---|---|
| metadata | 272.19 → 250.74 | 294.65 → 429.29 |
| read | 263.26 → 239.29 | 336.18 → 308.37 |
| write | 740.64 → 559.34 | 970.78 → 797.87 |
| git | 1096.91 → 1071.94 | 1158.24 → 1095.24 |
| Launch to exit | 9616.95 → 7328.27 | 9971.15 → 10148.77 |
The Local raw record docs/src/assets/benchmarks/.data/filesystem-service-20261005/local-performance.tsv
retain every sample. The two figure panels are independent batches, each
comparing old/new artifacts with matched build settings. They are not a same-batch
release/performance A/B or individual-mechanism gains.
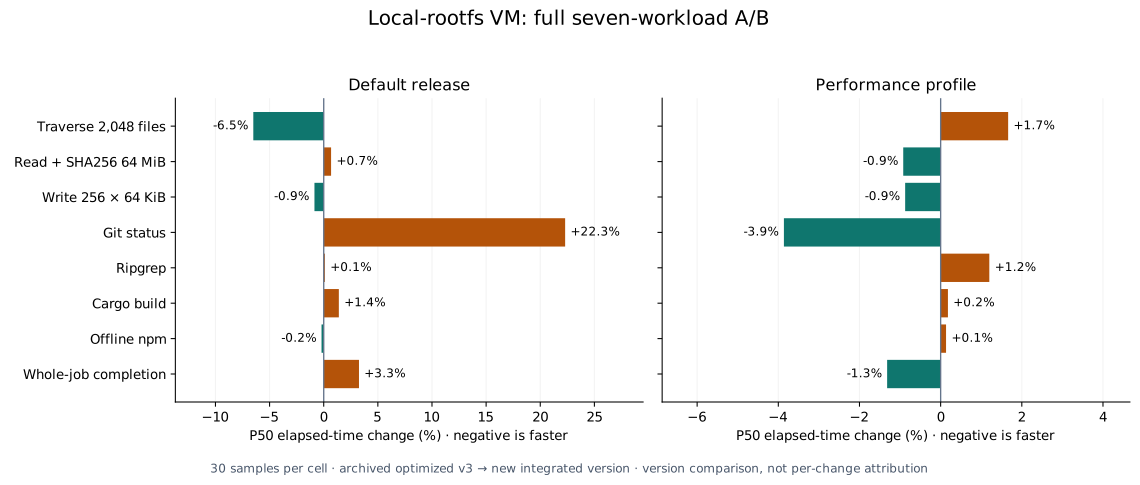
Lazy images: cold/warm comparison without intermediate host FUSE
Both artifacts use performance builds (opt-level=3) and read the same immutable rootfs through a local Unix-socket cache-v1 fixture. The Python cache server responds and verifies content hashes on separate physical cores 2,3; VM and runner use 0,1. No artificial latency is added. This is not a WAN, TCP/S3, registry-download or production Rust cache-server throughput measurement. One-minute host load is 1.00 → 1.85.
Each round shuffles version order, running cold then warm for each version. Cold uses fresh client content/metadata caches; warm reuses those disk caches but starts a new guest, backend projection and upper. Host page caches are not evicted. After tool startup the script waits a fixed 1.2 s, then measures first and immediate repeat traversal, first and immediate repeat open/read, 64 MiB SHA256 and 32 file copy-ups. “Immediate repeat” describes order, not guaranteed kernel cache hits: the default TTL can expire during long operations. The wait is excluded from workers and included in launch-to-exit, diluting whole-job percentage changes.
Four cells have three warmups and 30 measurements each, plus preflight: 120 jobs and 720 operation measurements. The 2,048 small files occupy 32 directories and contain 1,023 bytes each; 32 copy-up files are rewritten to 17 bytes and verified. All guest content/attribute, Run Bundle VM isolation, staged workspace-write and immutable-source checks pass. Mount monitoring observed host FUSE in all 60 baseline measurement jobs and no FUSE mount in the image store of all 60 new jobs.
Values below are P50 milliseconds; negative means less time.
| Operation | Cold before → after | Change | Warm disk cache before → after | Change |
|---|---|---|---|---|
| First traversal of 2,048 files | 257.74 → 285.25 | +10.7% | 223.41 → 254.04 | +13.7% |
| Immediate repeat traversal | 41.21 → 54.63 | +32.6% | 42.43 → 54.69 | +28.9% |
| Open/read/close 2,048 files | 823.29 → 795.42 | -3.4% | 637.58 → 582.75 | -8.6% |
| Immediate repeat open/read | 671.61 → 686.14 | +2.2% | 740.57 → 695.84 | -6.0% |
| 64 MiB read + SHA256 | 189.80 → 185.68 | -2.2% | 124.72 → 116.43 | -6.6% |
| Copy up and verify 32 small files | 28.30 → 73.41 | +159.4% | 28.83 → 72.56 | +151.7% |
| Launch to exit (includes 1.2 s wait) | 3596.20 → 3678.45 | +2.3% | 3314.47 → 3335.84 | +0.6% |
Reads improve locally: warm-cache open/read/close decreases 8.6%, and 64 MiB reads decrease 6.6%. First traversal instead increases 10.7%/13.7% for cold/warm caches, immediate repeat traversal increases 32.6%/28.9%, and copy-up takes 2.5–2.6× as long. Whole-job P50 changes +2.3% cold and +0.6% warm, without overall acceleration. A shorter call chain does not automatically remove metadata projection, content materialization, preimage recording and synchronization costs. This batch does not separately profile those costs or attribute a regression to one specific mechanism.
Every cold job downloads the same fixture data in both versions: 2,112 content reads and 69,203,968 bytes, comprising 2,048 small files and 64 large-file blocks. Including the interpreter and other rootfs content gives 2,164 reads and 86,924,150 bytes. Both warm versions download zero content and perform no remote stat/list queries. Differences are not due to extra prefetching or omitted data validation in the new version.
| Operation | Warm before → after P95 | Warm before → after P99 |
|---|---|---|
| First traversal of 2,048 files | 230.50 → 262.88 | 233.89 → 264.27 |
| Open/read/close 2,048 files | 643.50 → 599.41 | 644.50 → 633.51 |
| 64 MiB read + SHA256 | 126.19 → 119.56 | 126.61 → 119.89 |
| Copy up and verify 32 small files | 29.02 → 79.89 | 29.43 → 81.43 |
| Launch to exit (includes 1.2 s wait) | 3335.95 → 3377.97 | 3350.71 → 3438.46 |
Warm read tails improve in some cases; metadata/copy-up and whole-job tails
increase. Baseline cold open/read P99 of 1,628.39 ms and completion P99 of
4,406.78 ms are affected by one slow job; the new values are
804.34/3,736.05 ms. Selecting only those tails would not establish stable gains.
Local raw record docs/src/assets/benchmarks/.data/filesystem-service-20261005/lazy-performance.tsv
are retained. The first preflight failed because the script misstated fixture
byte size; corrected preflight and formal results are stored separately, with
that failure excluded from timing distributions.
Linux: retained results of the earlier five-item optimization campaign
These independent earlier batches produced this campaign's baseline artifacts. Their percentage changes cannot be added to the new results; the historical 16 GiB VM's 5.27 s versus the new 4.15 s is not solely a refactor gain. Final v3 combines path indexing, lazy directory allocation, queue changes and related work, with 2 vCPU/4 GiB, three warmups and 30 measurements per cell. It does not attribute gains to each mechanism. The mutable fixture does not quantify immutable-image receipt reuse.
| Comparison | VM P50 before → after | Change |
|---|---|---|
| Combined code changes, release: completion | 4,416.25 → 4,236.61 ms | -4.1% |
| Same batch: metadata | 194.21 → 169.20 ms | -12.9% |
| Same batch: npm | 1,504.83 → 1,395.37 ms | -7.3% |
| Same-source release → performance: completion, separate batch | 4,233.32 → 3,839.44 ms | -9.3% |
Combined release completion P95 changes +2.4% and Git P99 +25.5%;
separate performance completion P95/P99 change -7.9%/-6.9%. These tradeoffs
cannot be pooled into one speed curve. The Local raw record docs/src/assets/benchmarks/.data/filesystem-optimizations-20261005/code-v3-4g.tsv,
Local raw record docs/src/assets/benchmarks/.data/filesystem-optimizations-20261005/profile-v3-4g.tsv
and Local raw record docs/src/assets/benchmarks/.data/filesystem-optimizations-20261005/manifest.tsv
retain full provenance. Kernel-mechanism and P0 batches below are also historical.
Linux: full kernel-mechanism and concurrency evaluation
Screening precedes the unchanged seven-tool evaluation below. These are real filesystem jobs, not extrapolated adapter timings or three-sample screens. Retained changes fuse parent statx queries, share the lock for read-only OPEN, and add opt-in lock/pool diagnostics with no clock reads when disabled. READDIRPLUS_AUTO and inline metadata dispatch remain; DAX, writeback and long-lived caches are not enabled.
Completed experiments
| Experiment | Samples and measurement boundary | Results |
|---|---|---|
| Real KVM / host FUSE screening | Five candidate comparisons, each with five cells, one warmup and three measurements per cell; includes reruns after implementation corrections | Screening and decisions, Local raw record docs/src/assets/benchmarks/.data/filesystem-kernel-20261005/process.tsv |
| Release adapter microbenchmarks | Four lookup/getattr/open/directory PLUS workloads, two warmups and eight measurements per case and artifact; no VM, FUSE mount or preimage journaling | Local raw record docs/src/assets/benchmarks/.data/filesystem-kernel-20261005/micro-final.tsv |
| Cache, concurrency and guest tmpfs controls | Three measurements for traversal and single/four-thread stat; one for partial writes and readback on 64 files | Control results, Local raw record docs/src/assets/benchmarks/.data/filesystem-kernel-20261005/kernel-probe.tsv |
| Same-source full seven-tool A/B | Five cells, three warmups and 30 measurements per cell; 150 jobs and 1,050 tool measurements | Full distributions and conclusions |
| Same-batch full comparison of published P0 and final candidate | Five additional cells, three warmups and 30 measurements per cell; 150 jobs and 1,050 tool measurements; source and staged isolation types differ | Historical-artifact rerun |
| Separate profiling and OPEN concurrency regression | One profile measurement per cell, excluded from acceptance timings; regression checks old blocking behavior, new read-only concurrency and retained writable exclusion | Queue and lock diagnostics, implementation and regression |
The five cells are native, baseline/candidate host FUSE staged, and baseline/candidate KVM VM. The earlier P0 modification's N=30 A/B remains separate, outside the latest two rounds' 300 measured jobs. DAX, writeback cache, FUSE passthrough, FUSE-over-io_uring, long-lived TTLs and replacement with virtiofsd have only been assessed for feasibility; no performance A/B has been implemented for them.
Screening and implementation selection
Each real screen uses five cells, one warmup and three measurements per cell, frozen source, firmware and fixtures, with mandatory preflight. Combined variants are labeled; separate batches are not single-change comparisons. Screens select further work, not tail or whole-task performance claims.
| Candidate | VM traversal P50 change | VM completion P50 change | Decision |
|---|---|---|---|
| Initial fused statx | +4.8% | +5.9% | Missing upper parents still triggered duplicate fallback queries; fix and rerun |
| OPEN shared lock + metadata pool on statx | +1.4% | +8.2% | Do not promote this combination; npm +21.8% in this screen |
| Force READDIRPLUS, disable AUTO | -30.6% | +4.5% | Git +93.6%; do not enable globally |
| Fused statx + shared OPEN lock before correcting namespace-error fallback | -17.7% | +4.2% | Intermediate version; retain records, correct and rerun |
| Corrected statx + shared OPEN lock | +5.0% | +1.0% | Correctness passes; use full N=30 for evaluation |
Initially ordinary ENOENT/ENOTDIR also fell back from statx to metadata, offsetting some savings on lower queries. The final implementation returns those namespace results directly. Unsupported/restricted queries or missing fields fall back safely, with no guessed mount ID or native parent reuse. Physical ancestor and leaf checks remain, without cross-request attribute or permission caching.
A separate release adapter microbenchmark uses two warmups, eight measurements and one separate diagnostic per case, without VM, FUSE or preimage journaling. Deep-directory P50 is 97.52 → 88.16 ms (-9.6%); shallow lookup/open/getattr 28.39 → 27.61 ms (-2.8%). The final normal fixture has no metadata fallbacks and avoids 33,664 separate mount-identity queries in the deep case. This verifies reduced duplicate work, not a predicted VM-task gain.
The new regression reproduces read-only OPEN waiting behind independent backing READ: it fails the old implementation and passes the shared-lock implementation. Writable OPEN still waits and lower content stays unchanged. APPEND/TRUNC, non-read-only and kill_priv opens, mutations, release and snapshots remain exclusive. Per-path journals still synchronize first observations; handle, descriptor RAM-lease, used-ring and freeze-drain contracts remain. All five implementation-file hashes match the actual worktree.
Same-source full seven-tool A/B
Both release binaries use frozen bc08f457 source, differing by the retained
implementation patch. Each cell has three warmups and 30 measurements:
150 measured jobs and 1,050 tool measurements, all passing original output,
Run Bundle, isolation, lower-write absence and complete 256-file upper checks.
Each job has a fresh workspace/upper and runs the seven tools in their original
order; five cells shuffle with a fixed seed. The retained fixture still writes
256 × 64 KiB, checks 64 MiB and traverses 2,048 files with the original cargo/npm
inputs. Host cache is warm; affinity uses physical cores 0,1, VM 2 vCPU/16 GiB,
and firmware matches P0. Both same-source staged variants are
rootless_process, requiring read/write/non-bypassable boundaries. Published
P0 staged used host_process; its comparison is separate. CPUs are not exclusive;
host one-minute load is 2.02 → 2.70. Units below are ms; negative is faster.
| Workload | Native | Staged before → after | Change | VM before → after | Change |
|---|---|---|---|---|---|
| metadata | 4.88 | 77.96 → 78.14 | +0.2% | 188.38 → 194.35 | +3.2% |
| read | 32.62 | 69.39 → 68.94 | -0.7% | 154.14 → 156.15 | +1.3% |
| write | 3.89 | 202.64 → 202.92 | +0.1% | 252.50 → 254.62 | +0.8% |
| git | 15.13 | 172.44 → 173.35 | +0.5% | 493.02 → 433.31 | -12.1% |
| rg | 7.76 | 90.78 → 91.63 | +0.9% | 457.09 → 452.03 | -1.1% |
| cargo | 55.25 | 116.54 → 114.56 | -1.7% | 734.07 → 719.18 | -2.0% |
| npm | 175.58 | 267.20 → 263.22 | -1.5% | 1631.39 → 1625.45 | -0.4% |
| launch to exit | 468.52 | 1345.29 → 1310.05 | -2.6% | 5298.80 → 5273.93 | -0.5% |
The full run does not establish universal acceleration. Staged completion is -2.6%, VM completion -0.5%; VM Git is -12.1% in this batch, while metadata is +3.2%. The adapter's -9.6% must not be reported as VM traversal improvement, and Git cannot stand in for npm, writes or the complete task.
| Workload | Staged P95 before → after | VM P95 before → after | Staged after P99 | VM after P99 |
|---|---|---|---|---|
| metadata | 84.63 → 88.98 | 254.15 → 270.13 | 97.68 | 296.52 |
| read | 85.22 → 85.02 | 197.53 → 201.65 | 86.04 | 214.19 |
| write | 222.86 → 222.09 | 330.15 → 295.80 | 228.31 | 335.81 |
| git | 206.08 → 197.27 | 814.82 → 776.87 | 226.71 | 796.34 |
| rg | 96.04 → 98.05 | 478.63 → 531.83 | 101.09 | 660.30 |
| cargo | 147.37 → 144.05 | 812.44 → 831.76 | 150.25 | 846.64 |
| npm | 297.90 → 294.31 | 1909.17 → 1947.07 | 306.96 | 2093.77 |
| launch to exit | 5633.02 → 3808.26 | 5812.36 → 5766.30 | 5321.95 | 6031.76 |
Tails do not improve together. Candidate VM rg P99 goes 526 → 660 ms, npm 2001 → 2094 ms, completion 5917 → 6032 ms, while write tails fall. Staged completion tails include a few slow tasks and are not the sum of seven worker times. All distributions remain available; this is one full batch on a nonexclusive host.
Against same-batch native, candidate VM traversal is 39.8×, 256-file writes 65.4×, 64 MiB reads 4.8×, npm 9.3×. Repeated directory/attribute operations, small writes and VM tool execution remain substantial costs.
Published P0 artifact rerun in the same batch
The published pinned P0 candidate (a1020d4b plus shared stdio readiness fix)
is then compared with final P1: again three warmups and 30 measurements per cell,
an additional 150 measured jobs and 1,050 tool measurements, all passing
the same checks. Original fixture, firmware and two-core budget remain; load is
0.45 → 3.44. Units are ms. This is a same-batch artifact comparison with
different source bases, not attribution of every difference to statx or OPEN.
P0 staged is host_process, P1 rootless_process; each observed boundary
is validated strictly.
| Workload | P0 → P1 staged P50 | Change | P0 → P1 VM P50 | Change |
|---|---|---|---|---|
| metadata | 76.26 → 77.26 | +1.3% | 225.02 → 228.47 | +1.5% |
| read | 68.11 → 68.69 | +0.9% | 121.06 → 120.93 | -0.1% |
| write | 198.12 → 200.20 | +1.0% | 240.25 → 253.10 | +5.3% |
| git | 167.50 → 170.04 | +1.5% | 449.65 → 430.24 | -4.3% |
| rg | 89.01 → 89.85 | +0.9% | 465.98 → 460.27 | -1.2% |
| cargo | 111.08 → 111.62 | +0.5% | 654.27 → 625.52 | -4.4% |
| npm | 215.91 → 261.39 | +21.1% | 1662.16 → 1666.95 | +0.3% |
| launch to exit | 1224.50 → 1290.69 | +5.4% | 5164.78 → 5187.46 | +0.4% |
Second-batch VM completion is +0.4%, again without overall acceleration; Git is -4.3%, writes +5.3%. Staged npm is +21.1%, versus -1.5% in the previous same-source rootless comparison. Different execution boundaries and other source changes enter this artifact comparison; it is not a causal claim about the filesystem patch. The same P1 artifact traverses in 194 / 228 ms and reads in 156 / 121 ms across the two batches, demonstrating batch sensitivity. Neither faster-batch selection nor percentile pooling is valid.
Original P0 published traversal 195.24 ms remains below; the identical P0 artifact measures 225.02 ms here. Published-to-current differences likewise cannot be equated with code gains. Both complete evaluations total 300 measured jobs and 2,100 tool measurements. Evidence supports eliminating duplicate parent queries and read-only OPEN serialization, not universal end-to-end acceleration.
Local raw record docs/src/assets/benchmarks/.data/filesystem-kernel-20261005/full-historical.tsv ·
Local raw record docs/src/assets/benchmarks/.data/filesystem-kernel-20261005/historical-summary.tsv ·
Local raw record docs/src/assets/benchmarks/.data/filesystem-kernel-20261005/samples.csv
Cache, concurrency and guest-local controls
The separate diagnostic repeats traversal of the same 2,048-file fixture,
waiting 1.2 seconds before every expired-cache pass, including after the initial
rglob. Candidate VM results below are in ms. Tmpfs is verified as /dev/shm
inside the same guest; file preparation is excluded.
| Control | Measurements per group | P50 |
|---|---|---|
| Expired-cache traversal → immediate repeat | 3 | 233.11 → 105.11 |
| Single-thread → four-thread partitioned stat | 3 | 164.17 → 91.86 |
| Traversal on tmpfs in the same guest | 3 | 3.28 |
| 64 files, eight 1 KiB writes each with readback: shared view → guest tmpfs | 1 | 69.64 → 2.78 |
Immediate repetition shows caching helps, with substantial cumulative cost remaining. Overlapping submission reduces waits without proving concurrent Core execution. The partial-write control has one sample and is not acceptance evidence. Tmpfs excludes virtio-fs, Core, journal and storage latency together; the difference cannot all be attributed to transport.
A separate profile batch is excluded from acceptance timings. Last candidate VM checkpoints show 21,340 / 24,743 inline and 357 / 65 pool requests. Pool queue waits total 12.80 / 1.67 ms; completion-to-used-ring publication 5.16 / 1.22 ms. Combined read/write lock acquisition waits are about 1.09 / 2.55 ms, with individual maxima below 0.38 ms. This diagnostic does not show long lock waits, but excludes guest-to-host admission waiting and does not rule out inline serialization. Core checkpoints still show 121,768 / 169,649 parent observations and 63,375 / 65,488 fused statx queries, with no fallback records. Complete staged profiling records 341 journal fsync calls totaling about 119 ms. VM checkpoints are not final and may have different cutoffs. Inclusive spans are not summed; counters are not a complete syscall census.
The initial diagnostic stopped because it searched runs only, while --stage places the Run Bundle in stage. The failed batch is retained and corrected runs use new directories. The intermediate successful batch did not expire initial rglob caches; it is kept separately, excluded from final diagnostic timings. All normal staged writes remain in upper, with lower unchanged.
Priorities for further kernel mechanisms
- Directory/attribute/negative caches and invalidations. Repeated traversal remains expensive. Establish immutable or single-owner tree contracts before testing longer TTL and FOPEN_CACHE_DIR. Live lowers allow external host changes, and no active invalidation transport exists; do not extend TTL globally.
- Workload-aware READDIRPLUS and host concurrency. AUTO already exists, and forced PLUS has tradeoffs. Host fuser uses one synchronous callback loop. VM uses one request and one hiprio queue; short metadata runs inline, and a full pool pauses normal admission. More workers alone do not prove gains; measure queue/lock waits. ASYNC_READ/PARALLEL_DIROPS are already negotiated by the protocol server.
- Writeback cache. It may coalesce small writes, but requires durable preimages before mutation, dirty-page draining before terminal/export/snapshot, and partial-write/append/truncate correctness. Kernel I/O modes
- Data paths and local filesystems. DAX primarily removes data copies; no DAX A/B is performed here. FUSE-over-io-uring addresses host /dev/fuse, not direct replacement of VM virtqueues. FUSE passthrough needs a backing FD in the same kernel, not a host FD handed to the guest. Guest-local tmpfs or read-only block images/kernel filesystems merit separate evaluation with staging/recording/restore contracts preserved. DAX · io-uring · Passthrough
Validation passes: 97 Core tests (five skipped), 12 overlayfs tests, 294 VM tests (two skipped), 25 benchmark tests, all-targets Clippy for three relevant packages and benchmark Ruff. No semspec ledgers/snapshots were modified or approved. Evidence includes samples and failures, not only successful summaries. These numbers do not update macOS, startup, networking or complete Agent-loop measurements.
Local raw record docs/src/assets/benchmarks/.data/filesystem-kernel-20261005/full-same-source.tsv ·
Local raw record docs/src/assets/benchmarks/.data/filesystem-kernel-20261005/summary.tsv ·
Local raw record docs/src/assets/benchmarks/.data/filesystem-kernel-20261005/process.tsv ·
Local raw record docs/src/assets/benchmarks/.data/filesystem-kernel-20261005/micro-final.tsv ·
Local raw record docs/src/assets/benchmarks/.data/filesystem-kernel-20261005/kernel-probe.tsv ·
Local raw record docs/src/assets/benchmarks/.data/filesystem-kernel-20261005/profiles.tsv ·
Local raw record docs/src/assets/benchmarks/.data/filesystem-kernel-20261005/implementation.patch ·
Local raw record docs/src/assets/benchmarks/.data/filesystem-kernel-20261005/evidence.tar.gz ·
Local raw record docs/src/assets/benchmarks/.data/filesystem-kernel-20261005/manifest.tsv
Linux: 2026-10-05, P0 real VM/FUSE A/B baseline
This batch boots actual KVM VMs and mounts actual host FUSE, completing the
end-to-end check missing from the adapter experiment. Host devices are available;
the initial sandbox hid /dev/kvm and /dev/fuse. Both GNU/Linux release binaries
come from the same a1020d4b source archive and differ only in OverlayCore's
core.rs. Both include the same guest stdio readiness fix. Binary, firmware,
source patch and harness hashes are retained.
“After” means this pinned candidate artifact, measuring the incremental benefit of skipping marker probes for an unavailable upper. Other optimizations already in the archive are shared by both binaries and are outside the A/B difference; later commits do not automatically enter these measurements.
Each round shuffles five cells: native and both versions of FUSE staged and VM.
Each cell has three warmups and 30 measurements: 150 measured jobs and 1,050 tool
measurements, all correct. Every job has a fresh workspace/upper and executes the
seven workloads in order in one environment. Fixture copying is excluded. Host
caches are warm; all launch trees use physical host cores 0,1; VMs have 2 vCPU
and 16 GiB. The pinned historical fixture and product-v1 workload both write
256×64 KiB (16 MiB). Historical percentiles are not pooled. Concurrent
host activity remained: one-minute load average fell from 10.38 to 3.06. Affinity
is a shared execution budget, not exclusive CPUs. This is one screening batch.
Tool operation and validation P50 in ms; negative changes mean less elapsed time:
| Workload | Native | FUSE before→after | Change | VM before→after | Change |
|---|---|---|---|---|---|
| metadata | 4.93 | 92.38 → 78.25 | -15.3% | 224.36 → 195.24 | -13.0% |
| read | 32.56 | 68.30 → 67.82 | -0.7% | 116.98 → 117.90 | +0.8% |
| write | 3.90 | 201.36 → 198.92 | -1.2% | 243.10 → 257.16 | +5.8% |
| git | 15.11 | 190.36 → 170.46 | -10.5% | 484.14 → 494.86 | +2.2% |
| rg | 7.66 | 100.80 → 90.58 | -10.1% | 476.92 → 464.97 | -2.5% |
| cargo | 52.92 | 112.30 → 110.11 | -1.9% | 513.46 → 512.74 | -0.1% |
| npm | 173.19 | 221.67 → 217.47 | -1.9% | 1570.05 → 1503.67 | -4.2% |
Launch-to-exit P50 for the seven-workload job is 454.50 ms native, 1288.69 → 1230.93 ms (-4.5%) FUSE staged and 4829.04 → 4777.55 ms (-1.1%) VM. Metadata savings reproduce in the actual paths. This does not establish improvements for VM git, writes or overall jobs: VM write and git became slower in this batch. Small changes and write behavior need a quieter-host rerun; a single P50 cannot establish their cause.
P95 and remaining costs
P95 from the same samples, in ms. Lower medians did not consistently produce lower tail latency:
| Workload | FUSE before→after P95 | Change | VM before→after P95 | Change |
|---|---|---|---|---|
| metadata | 112.02 → 107.34 | -4.2% | 344.81 → 322.87 | -6.4% |
| write | 312.85 → 300.82 | -3.8% | 349.50 → 780.11 | +123.2% |
| git | 294.83 → 378.19 | +28.3% | 892.72 → 1181.58 | +32.4% |
| rg | 153.51 → 172.53 | +12.4% | 604.35 → 850.17 | +40.7% |
| Whole job, launch to exit | 2078.80 → 2152.45 | +3.5% | 6796.10 → 8565.53 | +26.0% |
Candidate staged / VM whole-job P99 is 13.36 s / 10.46 s, also retained in the raw summary. With N=30, a few slow samples influence the tail, and concurrent host load remains uncontrolled. These observations need reproduction before attributing them to an implementation change. Evidence supports metadata-path improvement; overall performance acceptance still needs repeated quieter-host batches.
Against same-batch native, candidate staged / VM metadata still takes 15.9 / 39.6 times as long, adding 73 / 190 ms per traversal. Writing 256 files still takes 199 / 257 ms, versus 3.90 ms native. VM offline npm takes 1.50 s, versus 0.17 s native. Repeated traversal, small-file writes and VM tool execution remain the next optimization targets.
An earlier warmup exited zero and completed writes without any workload stdout markers. The harness stopped and retained the failure. The ordinary VM runner now declares the named ports required by its actual non-terminal standard descriptors. The guest waits for their names before launching tools, failing after at most five seconds. Regression tests cover delayed names, later port creation and absent ports; there is no unconditional startup delay. All 68 VM runs in the formal batch, including preflight and warmups, passed output checks. The harness also verifies observed isolation, no writes in lower and all 256 upper files with correct sizes. Identical binaries, a mismatched build manifest, missing samples or interruption cannot produce a successful A/B summary.
A separate profiled batch does not enter the timing table. The candidate VM's two nonempty Core instances still record 126,034 / 168,027 parent metadata calls and 57,547 / 53,161 mount identity attempts at their last checkpoints. Dispatch checkpoints show 20,545 inline / 424 pool and 24,398 inline / 100 pool, with two workers each. The complete candidate host Core profile records 341 journal fsync calls totaling about 110 ms. Repeated Core physical path checks, first-observation/write journal costs and inline dispatch of small requests warrant separate experiments. Neither more workers nor virtiofsd can be assumed to remove these costs. VM checkpoints lack final records and are partial; nested inclusive spans must not be added, and admission time is not queue waiting time.
Validation passed: five guest tests, 292 full VM-package tests (two skipped), 24 executor tests excluding control and 24 benchmark tests, plus guest Clippy and benchmark Ruff. The wider executor subset in the worktree at measurement time had nine VM-control test failures, retained separately in the validation archive. This change does not modify control implementation or count those checks as passed.
Build both GNU/Linux binaries from the same source, applying only the proposed
change between builds. Use a fresh output directory and start with
--samples 1 --warmups 0 for preflight.
python3 benchmark/pvisor/filesystem_ab.py \
  --assets target/reference-env-final-20261004 \
  --baseline /absolute/path/to/pvisor-before \
  --candidate /absolute/path/to/pvisor-after \
  --firmware /absolute/path/to/libkrunfw-directory \
  --output target/filesystem-ab-new \
  --cpu-affinity 0,1 --samples 30 --warmups 3
Local raw record docs/src/assets/benchmarks/.data/filesystem-ab-20261005/samples.csv ·
Local raw record docs/src/assets/benchmarks/.data/filesystem-ab-20261005/summary.tsv ·
Local raw record docs/src/assets/benchmarks/.data/filesystem-ab-20261005/profiles.tsv ·
Local raw record docs/src/assets/benchmarks/.data/filesystem-ab-20261005/evidence.tar.gz
Retained historical-to-P0 comparison
This compares the 2026-10-04 complete-tool-environment N=30 batch with the latest candidate N=30 batch: internal tool P50 in ms. Both retain the tool fixture, but artifacts, host load and run protocols differ. Percentages describe differences across batches and cannot establish the controlled causal benefit of all optimizations. Use the same-batch A/B for the latest change's incremental benefit.
| Workload | Historical→latest staged | Across-batch change | Historical→latest VM | Across-batch change |
|---|---|---|---|---|
| metadata | 180.13 → 78.25 | -56.6% | 310.54 → 195.24 | -37.1% |
| read | 48.77 → 67.82 | +39.1% | 89.27 → 117.90 | +32.1% |
| write | 189.28 → 198.92 | +5.1% | 144.66 → 257.16 | +77.8% |
| git | 177.81 → 170.46 | -4.1% | 456.21 → 494.86 | +8.5% |
| rg | 144.61 → 90.58 | -37.4% | 545.82 → 464.97 | -14.8% |
| cargo | 112.80 → 110.11 | -2.4% | 549.57 → 512.74 | -6.7% |
| npm | 222.97 → 217.47 | -2.5% | 1727.04 → 1503.67 | -12.9% |
Existing measurements show lower traversal and search times; reads and writes did not improve alongside them. Docker, complete repair tasks and real Agent CLI loops were not rerun here. Historical data below retains its original dates and artifacts; filesystem percentages cannot predict their latest performance.
Local raw record docs/src/assets/benchmarks/.data/reference-env-20261004/summary.tsv ·
Local raw record docs/src/assets/benchmarks/.data/filesystem-ab-20261005/summary.tsv
Linux: 2026-10-05, OverlayCore resolution optimization
This release-mode experiment measures only the virtio-fs OverlayFs adapter,
without a VM, host FUSE mount or preimage journal. Fixtures live on /tmp
tmpfs: 32 directories with 64 files of 18 B each; deep paths have eight parent
components. Each trial has fresh inode tables and warm host caches. Fixture and
adapter construction are excluded from timing.
Preserved baseline and candidate test binaries were run through nextest binaries metadata in three alternating batches: old→new, new→old, old→new. Each case and batch has two warmups, eight unprofiled samples and one diagnostic sample. P50 uses only the 24 unprofiled samples per version. CPU affinity was not pinned; binary digests and individual batch medians are retained in the raw summary.
| Adapter operation, 2,048 files | Before P50 ms | After P50 ms | Elapsed reduction |
|---|---|---|---|
| lookup + getattr | 35.15 | 26.35 | 25.0% |
| lookup + open + getattr + release | 37.61 | 28.07 | 25.4% |
| Deep lookup + open + getattr + release | 170.51 | 96.85 | 43.2% |
| opendir + readdirplus + releasedir | 29.00 | 20.24 | 30.2% |
The shared OverlayCore now skips whiteout/opaque probes when this candidate's physical upper parent was just found missing or non-directory. Attributes and absence are not cached across requests; later components and final physical ancestors are still checked afresh. Deep-path diagnostic counts fell from 38,016 to 4,352 for each marker probe. Markers behind upper ancestor symlinks cannot hide lower entries. New tests also cover upper directories and whiteouts appearing within a walk and upper content changes between requests.
All 106 Core/host-adapter tests and 57 virtio-fs/descriptor/filesystem-snapshot
tests passed, as did Clippy for all targets of the three relevant packages. The initial
sandbox hid /dev/kvm and /dev/fuse, so that full VM-package attempt failed
at KVM initialization. This microbenchmark did not measure actual VM/FUSE jobs,
journaling, payload I/O or macOS. Subsequent host validation and end-to-end runs
appear in the P0 baseline above. Unrelated VM refactors
also occurred between builds; this adapter case does not execute UART/VMM/CPU
initialization. Binary digests identify the measured artifacts. These reductions
do not replace new measurements of the historical tool workloads below.
Reproduce one version's adapter measurement:
cargo nextest run --locked --release -p pvisor-vm \
  --run-ignored only --no-capture -E 'test(small_file_adapter_benchmark)'
Local raw record docs/src/assets/benchmarks/.data/overlay-resolution-20261005/samples.tsv · Local raw record docs/src/assets/benchmarks/.data/overlay-resolution-20261005/summary.tsv
Linux: 2026-10-04
Tool execution inside complete Ubuntu
The table excludes environment boot, measuring operations and grading. This new batch uses N=10 with 3 warmups, the same fixture and two-core budget, and 16 GiB VMs. pVisor uses host directories and staged virtio-fs; Ubuntu uses its vendor generic kernel, distribution tools and private ext4. The old Docker N=30 matrix remains separate without pooling percentiles.
| Workload | Native P50/P95 ms | pVisor staged P50/P95 ms | pVisor VM P50/P95 ms | Ubuntu P50/P95 ms |
|---|---|---|---|---|
| metadata | 4.85 / 5.11 | 177.80 / 195.52 | 291.82 / 359.75 | 18.64 / 19.90 |
| read | 33.29 / 48.97 | 48.12 / 61.21 | 88.83 / 127.21 | 115.51 / 117.69 |
| write | 3.75 / 4.43 | 186.95 / 208.86 | 134.37 / 154.03 | 36.07 / 36.35 |
| git | 14.66 / 17.07 | 172.18 / 194.52 | 613.69 / 807.73 | 136.50 / 140.81 |
| rg | 7.58 / 10.90 | 140.52 / 145.52 | 521.65 / 554.49 | 20.40 / 22.89 |
| cargo | 52.79 / 57.17 | 104.21 / 131.18 | 563.24 / 658.37 | 969.09 / 977.41 |
| npm | 218.82 / 245.85 | 256.29 / 292.67 | 2260.17 / 2408.63 | 1079.89 / 1110.93 |
These values locate waiting in traversal, search, compilation and installation. A single read does not establish that block devices always outperform FUSE: kernels, tool versions, storage and staging semantics differ together. For longer tasks, combine worker time with the complete loop rather than startup alone.
Local raw record docs/src/assets/benchmarks/.data/full-ubuntu-20261004/samples.csv · Local raw record docs/src/assets/benchmarks/.data/full-ubuntu-20261004/summary.tsv · Method and reproduction
Docker baseline in the complete tool environment
This adds a same-host Docker Engine measurement rather than relabeling Podman. Same two-core budget and inputs, 30 samples and 3 warmups per case; fixtures match the first edition, with seven operations executed sequentially in each fresh environment. Timings cover operations and validation, excluding environment startup. See the complete environment for the repair workflow. The two batches remain separate; percentiles are not pooled.
| Workload | Native P50/P95 ms | Docker P50/P95 ms | pVisor staged P50/P95 ms | pVisor VM P50/P95 ms |
|---|---|---|---|---|
| metadata | 5.04 / 6.78 | 5.06 / 7.50 | 180.13 / 202.88 | 310.54 / 351.59 |
| read | 33.07 / 41.44 | 33.24 / 45.06 | 48.77 / 61.60 | 89.27 / 99.34 |
| write | 3.96 / 5.09 | 3.95 / 5.65 | 189.28 / 204.67 | 144.66 / 164.67 |
| git | 15.75 / 20.50 | 16.07 / 20.07 | 177.81 / 195.97 | 456.21 / 786.35 |
| rg | 7.98 / 11.81 | 8.03 / 9.63 | 144.61 / 159.00 | 545.82 / 673.25 |
| cargo | 58.71 / 70.16 | 56.40 / 73.75 | 112.80 / 140.81 | 549.57 / 659.23 |
| npm | 183.46 / 197.57 | 231.45 / 288.60 | 222.97 / 256.33 | 1727.04 / 1978.79 |
This establishes a concrete position: Docker metadata/read/write stay close to native. Staged small-file traversal adds about 175 ms over Docker, and a 64 MiB read about 16 ms. An individual read costs tens of additional milliseconds; repeated small-file scans accumulate. VM offline npm installation takes about 1.73 seconds, against Docker's 0.23 seconds, a clear remaining gap. The roughly 86 ms VM startup figure cannot stand in for this tool budget.
Tasks verify file counts/sizes, SHA256, clean Git state, search matches, compiled output, and installed package counts. Docker uses a writable bind mount, pVisor a staged view, and Firecracker/QEMU private ext4. Different file paths are part of actual deployment cost; this is not a causal experiment changing only the VMM over an identical filesystem. The summary also contains each operation's distribution for other runtimes.
Configuration and reproduction · Local raw record docs/src/assets/benchmarks/.data/reference-env-20261004/samples.csv · Local raw record docs/src/assets/benchmarks/.data/reference-env-20261004/summary.tsv · Local raw record docs/src/assets/benchmarks/.data/reference-env-20261004/evidence.tar.gz · Local raw record docs/src/assets/benchmarks/.data/reference-env-20261004/compatibility.tsv
First-edition Linux matrix: separate batch
| Workload | Backend | N | Worker P50 ms | vs native | Wall P50 / P95 / P99 ms |
|---|---|---|---|---|---|
| metadata | native | 30 | 4.84 | +0.0% | 23.44 / 29.17 / 30.71 |
| metadata | host | 30 | 4.94 | +2.0% | 34.02 / 44.90 / 58.18 |
| metadata | staged | 30 | 149.60 | +2988.5% | 225.03 / 295.08 / 314.55 |
| metadata | safe | 30 | 171.26 | +3435.6% | 288.73 / 346.47 / 363.59 |
| metadata | vm | 30 | 263.08 | +5331.3% | 636.44 / 828.38 / 892.94 |
| metadata | podman | 30 | 4.95 | +2.1% | 138.99 / 158.58 / 159.34 |
| metadata | container | 30 | 4.83 | -0.3% | 320.21 / 419.26 / 479.51 |
| read | native | 30 | 32.66 | +0.0% | 52.81 / 125.98 / 143.36 |
| read | host | 30 | 31.80 | -2.6% | 64.65 / 213.37 / 232.88 |
| read | staged | 30 | 40.76 | +24.8% | 95.24 / 338.92 / 378.04 |
| read | safe | 30 | 41.38 | +26.7% | 153.98 / 386.69 / 390.96 |
| read | vm | 30 | 100.58 | +208.0% | 476.56 / 1379.77 / 1436.40 |
| read | podman | 30 | 32.68 | +0.1% | 170.64 / 408.95 / 452.05 |
| read | container | 30 | 33.57 | +2.8% | 405.55 / 945.63 / 1092.93 |
| write | native | 30 | 3.81 | +0.0% | 22.95 / 26.54 / 55.29 |
| write | host | 30 | 3.81 | -0.1% | 34.16 / 46.23 / 93.69 |
| write | staged | 30 | 192.46 | +4945.6% | 252.61 / 444.20 / 812.30 |
| write | safe | 30 | 199.56 | +5131.6% | 312.83 / 549.31 / 762.48 |
| write | vm | 30 | 114.68 | +2906.4% | 476.94 / 694.88 / 1003.73 |
| write | podman | 30 | 3.76 | -1.4% | 139.68 / 151.53 / 340.87 |
| write | container | 30 | 3.82 | +0.1% | 356.89 / 406.97 / 627.19 |
| git | native | 30 | 14.72 | +0.0% | 36.14 / 79.21 / 165.50 |
| git | host | 30 | 14.51 | -1.4% | 54.34 / 65.11 / 92.63 |
| git | staged | 30 | 203.33 | +1281.7% | 333.16 / 458.84 / 1316.66 |
| git | safe | 30 | 225.99 | +1435.7% | 394.38 / 491.36 / 960.78 |
| git | vm | 30 | 535.06 | +3536.0% | 929.22 / 1558.97 / 2447.31 |
| git | podman | 30 | 15.55 | +5.7% | 158.87 / 209.35 / 215.16 |
| git | container | 30 | 15.78 | +7.2% | 375.18 / 434.76 / 490.77 |
| rg | native | 30 | 6.72 | +0.0% | 26.54 / 28.70 / 29.90 |
| rg | host | 30 | 6.64 | -1.2% | 44.01 / 44.79 / 45.02 |
| rg | staged | 30 | 167.90 | +2399.9% | 288.07 / 312.76 / 320.23 |
| rg | safe | 30 | 190.82 | +2741.2% | 349.80 / 380.69 / 389.61 |
| rg | vm | 30 | 340.98 | +4976.9% | 717.00 / 769.33 / 780.18 |
| rg | podman | 30 | 5.90 | -12.2% | 141.36 / 154.73 / 160.82 |
| rg | container | 30 | 6.39 | -4.8% | 355.33 / 390.96 / 395.69 |
| cargo | native | 30 | 49.09 | +0.0% | 67.21 / 84.93 / 86.36 |
| cargo | host | 30 | 47.07 | -4.1% | 83.86 / 94.88 / 95.49 |
| cargo | staged | 30 | 90.31 | +84.0% | 146.28 / 167.31 / 168.42 |
| cargo | safe | 30 | 96.00 | +95.6% | 188.83 / 209.83 / 224.90 |
| cargo | vm | 30 | 541.56 | +1003.1% | 897.61 / 959.14 / 959.43 |
| npm | native | 30 | 157.56 | +0.0% | 175.60 / 205.84 / 434.16 |
| npm | host | 30 | 156.38 | -0.7% | 184.73 / 204.95 / 552.20 |
| npm | staged | 30 | 187.87 | +19.2% | 235.76 / 256.13 / 608.48 |
| npm | safe | 30 | 232.30 | +47.4% | 318.58 / 432.25 / 708.12 |
| npm | podman | 30 | 208.41 | +32.3% | 339.64 / 474.65 / 857.37 |
| npm | container | 30 | 195.29 | +23.9% | 515.88 / 552.03 / 891.62 |
Analysis
Staged sequential reads cost about +25% and offline npm +19%. Metadata is about 31× native and small-file writes about 50×, adding roughly 150–190 ms to native operations lasting only milliseconds. Host worker time is near native; full jobs include CLI/recording overhead. Safe adds namespace/policy/proxy setup. Most measured VM jobs take roughly 0.5–1 second.
This historical batch uses Podman as the OCI control; Docker daemon access was unavailable then. A later batch adds rootless Docker Engine bind-mount measurements, shown in the complete-environment comparison above. Docker overlay2 and Docker Desktop remain unmeasured. pVisor OCI prepares a private rootfs per Job; wall time includes this while worker time isolates tool execution.
Compatibility follow-up
Container cargo initially lacked linker startup files, a fixture-image error. After adding glibc/GCC files, Fedora linker scripts still required /lib64/libmvec.so.1. The final cargo-ready batch supplies that path and passes every sample, listed separately; both setup failures remain in reports. VM Node failed to reserve V8 address space with the 1 GiB shape; follow-up uses a 16 GiB address-space configuration, kept separate from the main 1 GiB batch.
| Workload | Backend | N | Worker P50 / P95 / P99 ms | Wall P50 / P95 / P99 ms |
|---|---|---|---|---|
| cargo | native | 30 | 52.90 / 65.79 / 76.17 | 71.96 / 89.41 / 103.04 |
| cargo | host | 30 | 52.60 / 70.49 / 75.30 | 84.38 / 111.79 / 124.56 |
| cargo | staged | 30 | 116.07 / 139.93 / 233.90 | 166.65 / 210.57 / 397.55 |
| cargo | safe | 30 | 119.77 / 138.77 / 228.23 | 209.92 / 242.16 / 342.22 |
| cargo | vm | 30 | 567.42 / 1365.43 / 2047.17 | 1271.15 / 2683.43 / 3889.27 |
| npm | native | 30 | 162.86 / 433.44 / 488.04 | 181.47 / 472.60 / 531.93 |
| npm | host | 30 | 163.56 / 430.53 / 475.14 | 205.34 / 522.04 / 595.23 |
| npm | staged | 30 | 213.17 / 437.03 / 612.15 | 266.48 / 544.87 / 780.57 |
| npm | safe | 30 | 256.70 / 717.56 / 777.67 | 339.63 / 983.34 / 1085.49 |
| npm | vm | 30 | 985.29 / 3238.12 / 4617.06 | 1661.91 / 5172.18 / 5755.11 |
| npm | podman | 30 | 217.06 / 547.44 / 833.45 | 365.17 / 883.42 / 1239.59 |
| npm | container | 30 | 202.48 / 587.65 / 601.74 | 550.89 / 1368.06 / 1469.75 |
| Cargo corrected /lib64 image | N | Worker P50/P95/P99 ms | Wall P50/P95/P99 ms |
|---|---|---|---|
| native | 30 | 51.52 / 59.70 / 62.44 | 70.85 / 80.25 / 82.02 |
| podman | 30 | 49.29 / 54.35 / 55.75 | 181.18 / 187.71 / 189.70 |
| container | 30 | 51.99 / 57.94 / 59.96 | 405.08 / 425.10 / 425.46 |
Limits and next measurements
Main VM jobs use host rootfs /, 2 vCPU/1 GiB and a host read view. This is a tool compatibility profile; host-secret protection is tested separately in isolation. These small offline warm-cache tasks do not establish full-repository build performance or cold-disk throughput. macFUSE/FSKit, actual registry installs and Docker/overlay2 await comparable measurements.
Sources and reproduction
Batch archival conventions are documented in the lab-notes index.
python3 benchmark/pvisor/product_v1.py \
  --binary /absolute/path/to/gnu-linux/pvisor \
  --firmware /absolute/path/to/libkrunfw-directory \
  --replay-binary /absolute/path/to/pvisor-replay \
  --output target/product-benchmark-new \
  --suites filesystem --samples 30 --warmups 3
Harness environment, preflight and failure-classification conventions match the end-to-end task analysis reproduction section; the local raw-record cohort is likewise product-v1-20261004, and the executable SHA256 identifies the measured artifact.