How long do file-intensive tasks take?
Motivation
pVisor host is close to direct execution for the tested repository checks and incremental builds. When VM isolation is needed and writes can merge before synchronization, guest writeback shortens publication waiting. VM file access still has additional costs: faster startup does not guarantee faster tasks, and larger working sets can time out.
The three-round publication median is 1.545 s for Native, 11.675 s for the default pVisor VM and 6.171 s for its writeback configuration. Default VM Ready is 101.75 ms. Task completion, startup and resource failures are reported separately.
Experiment design
Measure work plus final synchronization for repository inspection, incremental builds and publication as task completion time. It represents the wait imposed by the selected execution mode for file tasks. A lower time means faster completion within the same budget.
Nine modes on one host share static workloads, deterministic read-only inputs and Python/git/C tools, with images and disks prepared beforehand. Linux x86_64 / Ryzen 7 9700X / Btrfs; the entire process tree and private Docker share a two-core quota, 2 GiB and zero swap, with CPU affinity 0,1. VMs have 2 vCPUs/512 MiB; a parent-group cap for Native, host and containers is not equivalent to guest RAM. Tools come from a frozen Fedora 45 environment; the stock reference kernel is 7.2.11-300.fc45. pVisor uses the static release with matching embedded firmware.
Twelve mechanism workloads, four resource workloads and three workflows each use three fresh environments per mode, in randomized order, with three dependent rounds per environment. Sum the three completion times inside each environment before taking the median across environments. Host page caches remain warm; later rounds inherit verification-warmed pages. Ready runs from a shared pre-exec marker to payload Ready, excluding namespace preparation, task, exit and cleanup; it is separate from task clocks.
Each measured executor process has a 90-second limit and must exit normally, validate every round and pass an independent host final-state oracle. Staged modes must preserve the original workspace. After the first mode/workload failure, remaining planned observations for that cell are not run. Incomplete N=3 cells get no median or zero filling, and valid slow values remain. N=3 is exploratory, without reliable tails, cold-disk conclusions or cross-host rankings.
Data and analysis
Startup and complete tasks
| Mode | Ready ms | Repository s | Incremental build s | Publication s |
|---|---|---|---|---|
| Native | 0.56 | 0.051 | 0.045 | 1.545 |
| pVisor host | 17.64 | 0.050 | 0.045 | 1.549 |
| pVisor staged | 22.79 | 0.454 | 0.083 | 4.556 |
| pVisor VM | 101.75 | 2.376 | 0.557 | 11.675 |
| pVisor VM + writeback | 103.45 | 2.289 | 0.353 | 6.171 |
| Docker | 52.60 | 0.052 | 0.048 | 1.637 |
| Firecracker (stock kernel) | 302.11 | 0.137 | 0.061 | 5.074 |
| QEMU q35 | 636.23 | 0.099 | 0.058 | 3.170 |
| QEMU microvm | 247.87 | 0.133 | 0.055 | 3.433 |
Ready is in ms and tasks in s, medians across three fresh environments. Task columns sum three rounds per environment, excluding initial preparation and additional verification. Every build round edits a real translation unit and every publication creates a new directory. First image acquisition is excluded.
Host checks and builds stay close to Native; staging and VM file access add waiting. The pVisor VM becomes ready before the same-cohort stock reference VMs, but that does not offset repository and publication access costs. Writeback shortens publication; suitability still depends on complete task time.
Task ranges and resident-round changes
N=3 median [minimum–maximum], seconds; three dependent rounds are not nine independent samples.
| Mode | Repository s | Incremental build s | Publication s |
|---|---|---|---|
| Native | 0.051 [0.051–0.056] | 0.045 [0.045–0.046] | 1.545 [1.540–1.619] |
| pVisor host | 0.050 [0.049–0.051] | 0.045 [0.045–0.046] | 1.549 [1.527–1.578] |
| pVisor staged | 0.454 [0.449–0.454] | 0.083 [0.083–0.085] | 4.556 [4.528–4.593] |
| pVisor VM | 2.376 [2.109–2.392] | 0.557 [0.556–0.576] | 11.675 [11.218–11.910] |
| pVisor VM + writeback | 2.289 [2.280–2.371] | 0.353 [0.349–0.366] | 6.171 [6.047–6.517] |
| Docker | 0.052 [0.051–0.057] | 0.048 [0.047–0.052] | 1.637 [1.561–1.644] |
| Firecracker (stock kernel) | 0.137 [0.136–0.154] | 0.061 [0.061–0.073] | 5.074 [5.005–5.081] |
| QEMU q35 | 0.099 [0.095–0.101] | 0.058 [0.055–0.059] | 3.170 [3.160–3.288] |
| QEMU microvm | 0.133 [0.132–0.143] | 0.055 [0.055–0.056] | 3.433 [3.350–4.858] |
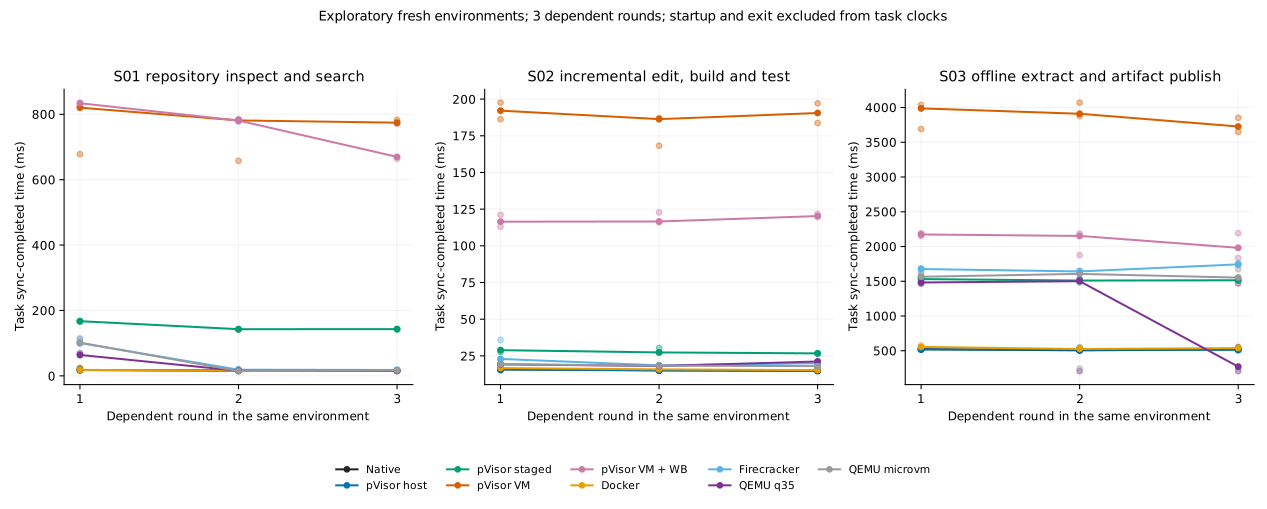
Points are independent environments; lines are corresponding-round medians. Tasks are assessed separately without a composite score. Repeated access does not give an ordinary mutable workspace Immutable-lower cache eligibility.
Small writes and synchronization
| Mode | 1 KiB writes ms | 1 MiB writes ms | Sync every 4 KiB ms |
|---|---|---|---|
| Native | 18.904 | 11.367 | 261.038 |
| pVisor host | 17.623 | 10.722 | 254.600 |
| pVisor staged | 193.411 | 13.740 | 280.462 |
| pVisor VM | 649.800 | 24.794 | 303.493 |
| pVisor VM + writeback | 31.084 | 31.827 | 396.031 |
| Docker | 20.274 | 12.177 | 250.648 |
| Firecracker (stock kernel) | 30.513 | 22.107 | 831.941 |
| QEMU q35 | 17.759 | 14.857 | 882.360 |
| QEMU microvm | 17.777 | 14.844 | 909.498 |
Milliseconds, N=3 medians of three-round completion sums. Sequential writes total 4 MiB per round; synchronous writes total 1 MiB, fsyncing every 4 KiB. Synchronization semantics determine merge opportunities; write-return time alone omits completion costs.
Request sizes, synchronization and all mechanisms
| Operation ms | Native | pVisor host | pVisor staged | pVisor VM | pVisor VM + writeback | Docker | Firecracker (stock kernel) | QEMU q35 | QEMU microvm |
|---|---|---|---|---|---|---|---|---|---|
| Positive lookup | 4.545 | 4.588 | 32.248 | 105.383 | 139.245 | 5.397 | 14.812 | 8.118 | 8.381 |
| Negative lookup | 2.498 | 2.403 | 77.970 | 432.963 | 432.771 | 2.988 | 15.931 | 15.233 | 15.304 |
| Directory enumeration | 2.466 | 2.505 | 9.566 | 16.214 | 16.132 | 2.749 | 4.623 | 3.289 | 3.950 |
| Reopened sequential read | 28.535 | 27.980 | 37.146 | 40.205 | 39.982 | 28.597 | 37.083 | 33.021 | 31.538 |
| Fixed shuffled read | 10.357 | 10.240 | 27.742 | 137.974 | 163.752 | 10.479 | 139.761 | 100.418 | 154.622 |
| 1 KiB writes | 18.904 | 17.623 | 193.411 | 649.800 | 31.084 | 20.274 | 30.513 | 17.759 | 17.777 |
| 1 MiB writes | 11.367 | 10.722 | 13.740 | 24.794 | 31.827 | 12.177 | 22.107 | 14.857 | 14.844 |
| 4 KiB overwrite | 11.668 | 11.893 | 55.527 | 150.683 | 26.931 | 12.081 | 38.049 | 14.445 | 16.400 |
| Small files | 280.802 | 277.178 | 380.104 | 820.276 | 691.822 | 276.624 | 391.725 | 357.702 | 403.307 |
| Per-write fsync | 261.038 | 254.600 | 280.462 | 303.493 | 396.031 | 250.648 | 831.941 | 882.360 | 909.498 |
| Mixed read/write | 16.069 | 16.855 | 64.701 | 174.719 | 37.030 | 22.251 | 34.416 | 23.280 | 22.606 |
| Create and remove | 145.796 | 146.854 | 266.569 | 668.033 | 626.365 | 141.702 | 442.769 | 449.161 | 472.677 |
Milliseconds, three-round sums including final synchronization. Logical operation counts are not guest-to-host request counts.
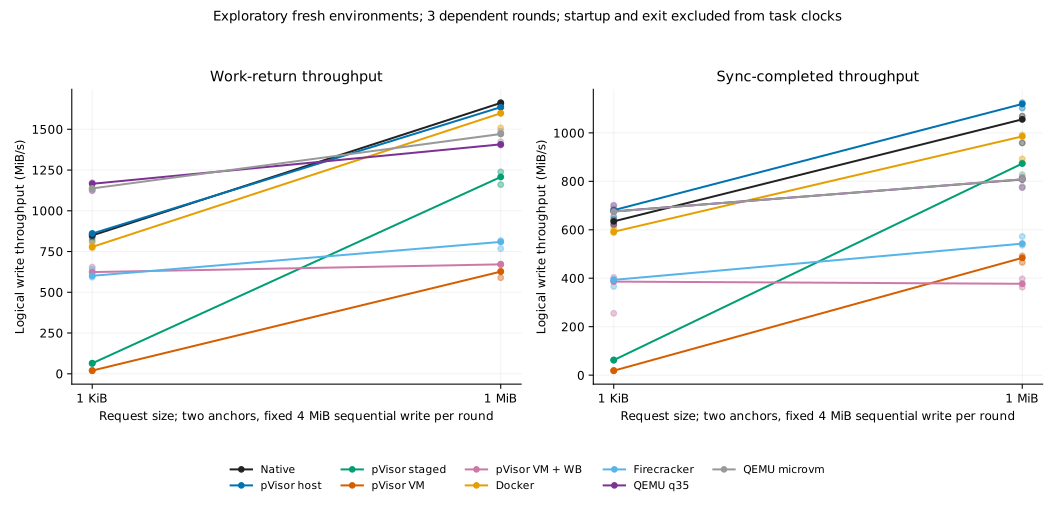
The two sizes are measured anchors; connecting lines do not establish intermediate sizes.
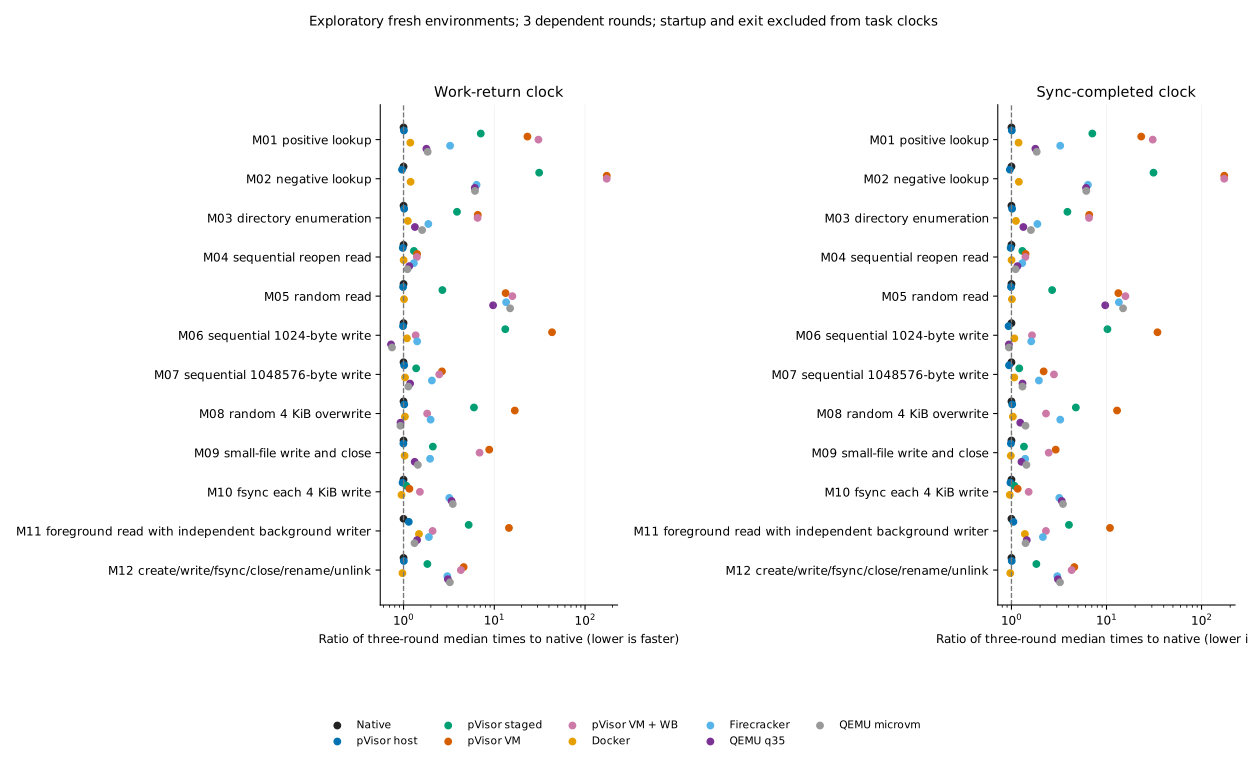
Native's same-cohort median is 1, lower is faster. These are descriptive levels, not confirmatory speedups.
| Mode | First-round foreground read ms | First-round completion ms |
|---|---|---|
| Native | 3.365 | 5.706 |
| pVisor host | 4.986 | 7.904 |
| pVisor staged | 5.549 | 22.133 |
| pVisor VM | 13.722 | 70.610 |
| pVisor VM + writeback | 12.131 | 21.692 |
| Docker | 3.410 | 7.124 |
| Firecracker (stock kernel) | 14.161 | 17.317 |
| QEMU q35 | 8.167 | 11.158 |
| QEMU microvm | 7.893 | 11.203 |
Foreground reads and background writes use different files. First-round read latency is separate so overall throughput does not hide foreground responsiveness.
Working set and concurrency
| Mode | 128 MiB × 1 s | 128 MiB × 4 s | 640 MiB × 1 s | 640 MiB × 4 s |
|---|---|---|---|---|
| Native | 2.446 | 1.362 | 2.672 | 2.529 |
| pVisor host | 2.431 | 1.337 | 3.365 | 1.576 |
| pVisor staged | 13.149 | 9.064 | 14.070 | 9.295 |
| pVisor VM | 43.460 | 16.411 | — | — |
| pVisor VM + writeback | 4.412 | 1.816 | — | — |
| Docker | 2.527 | 1.424 | 3.150 | 2.352 |
| Firecracker (stock kernel) | 2.802 | 1.615 | 5.348 | 2.577 |
| QEMU q35 | 2.284 | 1.400 | 3.875 | 1.866 |
| QEMU microvm | 2.464 | 1.386 | 3.900 | 2.010 |
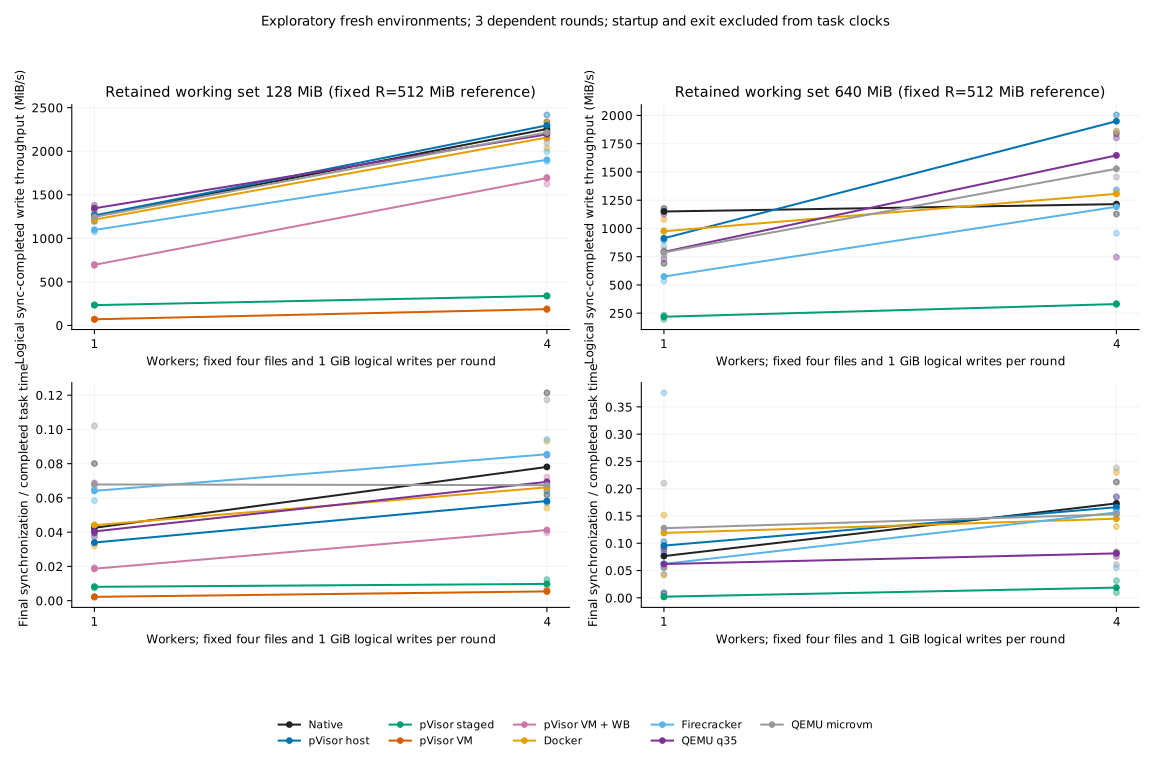
Seconds, N=3 medians of three-round completion sums. Every round writes a logical 1 GiB across four files; only working set and workers change. — means incomplete N=3, not zero time. Larger working sets also increase retained and synchronized bytes; four anchors do not establish a capacity knee.
Working-set plots and failures
| Mode | Workload | Environment | Outcome |
|---|---|---|---|
| pVisor VM + writeback | 640 MiB × 1 | 1 | timeout |
| pVisor VM | 640 MiB × 1 | 1 | timeout |
| pVisor VM | 640 MiB × 4 | 1 | timeout |
| pVisor VM + writeback | 640 MiB × 4 | 1 | timeout |
Failures and timeouts retain their raw evidence. Successful rounds do not replace failed environments.
Startup range
Ready medians and ranges for nine modes
| Mode | Ready ms [min–max] |
|---|---|
| Native | 0.56 [0.56–0.61] |
| pVisor host | 17.64 [17.34–18.25] |
| pVisor staged | 22.79 [22.79–22.87] |
| pVisor VM | 101.75 [100.73–104.92] |
| pVisor VM + writeback | 103.45 [101.50–106.76] |
| Docker | 52.60 [49.85–57.38] |
| Firecracker (stock kernel) | 302.11 [296.11–325.60] |
| QEMU q35 | 636.23 [634.79–655.04] |
| QEMU microvm | 247.87 [240.66–284.25] |
Fixed positive-metadata workload, N=3 median [minimum–maximum]. Ready observations from different workloads are not pooled into a larger N. This is a common static program's readiness, including reference-VM kernel startup, rather than full distribution services.
Configuration and coverage
The plan contains 19 workloads × 9 modes × 3 fresh environments = 513 environments. 505 ran: 501 passed and 4 failed; 8 further observations were not run under the registered rule. 167 / 171 cells have complete N=3 results, with 1503 valid round records.
Storage paths, clocks and valid observations
This comparison uses the common directory rootfs, without lazy cache. Compressed-image access costs are measured separately in the image experiment.
Native/host output uses Btrfs; staged uses FUSE; both pVisor VM modes use virtio-fs, OverlayFS and staged output. Ordinary CLI Jobs use spawn; host writeback and product DAX are disabled, with guest writeback requested off/on. Docker uses a new private rootless overlay2 daemon, writable-layer output and read-only bound input; output is copied out after exit for the common oracle.
Firecracker, QEMU q35 and QEMU microvm share an unmodified official stock kernel, matching module initrd, minimal PID1 and private ext4 root/work disks. virtio-blk, FLUSH and clean unmount remain enabled. QEMU microvm uses ACPI device discovery. Disk preparation, container creation and output export are excluded from Ready/task clocks. Tool, kernel and storage-stack differences belong to the measured configurations; they are not pure VMM overhead.
The repository and offline package each contain 1,024 files of 4 KiB. The build has 100 translation units; publication adds 128 files of 4 KiB and a 32 MiB streamed artifact. Resource working sets of 128/640 MiB use a fixed 512 MiB reference, not actual Native/container RAM proportions. The host user cgroup has no delegated cpuset: inherited affinity is reported without claiming a hard cpuset for early runc. File/directory synchronization, full content checks and staged isolation remain intact.
Historical data
Earlier seven-tool, five-mode and nine-mode results retain their original scopes. They are not pooled with current samples or used for cross-cohort optimization ratios.
Evidence and reproduction
All workload levels · Ready · Failures and missing observations · Provenance
2026-10-25, source 9e1b8f15, based on main 92a4ce4e. Full raw observations, frozen tools/binaries/firmware, failed preflights and derived plots remain locally in benchmark/filesystem/.data/user-rebase-20261025-c/; the previous public materials are archived there too. Reproduction · Cache and asynchronous-write engineering analysis. Engineering attribution does not fill missing user results.