Filesystem performance: technical analysis and experiment records
Current Linux HOST kernel caching and evidence
Under an explicit ownership contract, the Linux HOST API supports writable Metadata and read-only MetadataAndData; current-source correctness tests and independent request counters are valid, while formal performance acceptance remains blocked. Kernel caching and the service-side immutable-lower physical metadata cache below are separate mechanisms. Neither automatically changes product executor defaults.
Policies and admission contract
pvisor_overlayfs::api::OverlayMountConfig.kernel_cache explicitly selects the policy. Default behavior remains unchanged; no environment variable automatically enables extended policies.
| Policy | Entry/attr TTL | Negative TTL | Regular-file opens and scope |
|---|---|---|---|
Disabled (default) |
Legacy 1 second | 0 | No KEEP_CACHE; preserves the old default |
Uncached |
0 | 0 | No KEEP_CACHE; explicit metadata-cache-off control |
Metadata |
Configured, 0 < TTL <= 60s |
Same configured value | No KEEP_CACHE; supports writable Linux HOST views |
MetadataAndData |
Configured, 0 < TTL <= 60s |
Same configured value | KEEP_CACHE only for stable read-only regular files; writable configurations explicitly rejected |
Configured TTL defaults to 60 seconds and is ignored by Disabled/Uncached. Uncached does not enable DIRECT_IO: normal kernel page caching within an open handle remains. No policy enables writeback caching.
Extended policies require every physical lower explicitly declared Immutable in order, both OwnedViewContract assertions affirmed, explicit StableView read semantics, default_permissions and owner-only FUSE access. Contents, namespace, permissions, ownership, xattrs, hardlink aliases, physical ancestors and mount identities must remain stable. Only this adapter may mutate upper/work, which remain exclusive until actual detachment. Reads must not change backing atime: merged-mount NoAtime does not replace real backing noatime or an equivalent guarantee. A read-only mount, image digest or advisory lock does not prove these conditions. The adapter retains nonblocking exclusive flock locks on canonical upper/work directory objects; they coordinate cooperating opt-in sessions only, not out-of-band host writers.
Admission rejects journals/preimages, compact journal initialization, read metrics sinks, all custom path policies (including bound contexts) and exclusions before preparation I/O, without downgrading or silently skipping observations. StableView accepts that cache hits bypass callbacks; it provides no per-read audit, first-content-observation journal, snapshot or review compatibility. macOS and VM do not support extended policies. Virtio-fs lacks an equivalent verified notification output transport, and this DTO is not propagated into runtime/VM configuration.
Mutation effects and failure boundaries
Precise effects are collected before and after mutations, including requests that fail after partial copy-up or upper modification. Effects cover known object inodes, hardlink aliases, parent/ancestor attributes and exact namespace entries. Rename/exchange/removal include known subtrees, replaced objects and old/new entries; parent attribute changes do not expand into unrelated sibling-entry eviction. Covered operations include create/mknod/mkdir/symlink, unlink/rmdir, rename/exchange, link, writable open/copy-up/O_TRUNC, write, setattr, xattrs, fallocate and copy_file_range.
Copy-up and recursive directory materialization bind new physical objects back to existing FUSE identities. Late-discovered lower hardlink aliases obtain current upper identity and attributes from the Core owner-session copied_hard_link_metadata mapping. It survives adapter FORGET/reclaim; lookup/readdirplus materialize upper aliases when needed and record effects. The mapping belongs only to the current Core owner/session and is not persisted across rebuilds, reconstruction or new sessions. Adapter inode tables or canonical paths cannot replace it.
Pending is incremented before mutation, temporarily forcing zero TTL on metadata/entry replies, including mutation replies. An independent reply worker performs metadata-only inval_inode(ino, -1, 0) on affected inodes before replying; Linux cooperative mutation handling updates direct dentry/page-cache state. A separate entry worker asynchronously sends additional inval_entry(parent, name) notifications and expires attributes again. Long TTLs resume only after all batches complete. Entry notifications need not precede syscall completion. The reply worker never waits for the entry worker; FUSE callbacks do not wait for workers, notify the kernel or detach mounts. Writable inodes receive no blanket data invalidation that could wait on dirty pages/related writes; Metadata uses no KEEP_CACHE.
WRITE uses each request's current open flags, honoring dynamic clearing/restoring of O_APPEND. COPY_FILE_RANGE clears stale backing-fd O_APPEND before positional copying, without requiring an intervening WRITE. Errors after partial copying return the written byte count so the kernel learns about actual modifications.
Reply/entry queues each hold at most 256 batches, the stop queue 513 items, and global reservations at most 512 mutation batches. Each effects plan holds at most 4096 inode/entry keys plus one overflow sentinel. Overflow, worker panic or notification errors (except harmless ENOENT) stop the session; upper modifications are not rolled back. Writable admission requires the real fusectl abort endpoint and a disposable mount at the actual mountpoint verifying detach→abort. Users must not start before mount() returns.
Failure workers detach and verify mountinfo before writing connection abort; failed detach prevents the abort write. Helpers, termination, worker joins and shutdown have bounded waits, with a 15-second outer shutdown deadline; fatal termination failure ends the server process. Individual notifier calls have no independent deadline; termination limits do not guarantee that every mutation syscall completes within those limits. Abort/server death cannot revoke other processes' warm caches, and successful detachment cannot revoke held fds. EIO is not a general detachment fence. Callers must supervise and stop every user, release fds, retain backing for recovery, prohibit exported bind/namespace/FD aliases, and preserve namespace, credentials, helpers and detach permissions. Experiment failure evidence includes FUSE tasks waiting in request_wait_answer after namespace kill; simple-process termination probes do not establish immediate bounded cleanup for every FUSE wait.
Current validation and measurement scope
Targeted validation records on 2026-10-07 report 58 passed / 9 skipped for pvisor-overlayfs and 124 passed / 5 skipped for pvisor-overlay-core, plus 7 passed explicitly executed real-mount tests. Regressions cover late-hardlink identity after inode reclamation, dynamic APPEND with positional copy, and partial-copy failures. Independent source review found no new blocking issues in these identity and copy fixes. The validation scope does not include a comprehensive audit or performance acceptance.
B-FS-ENG plans a same newly frozen release-binary comparison of native, legacy-writable, Metadata-writable60s, Metadata-readonly60s and MetadataAndData-readonly60s: 3 warmups and 30 samples/cell, CPUs 0,1, seed 4207, 2048 byte-verified files in 32 half-deep branches. Writable comparisons hold view semantics fixed; KEEP_CACHE attribution compares only the two read-only conditions. Hot/readsearch/TTL operations have immediate priming. The TTL window waits 1.1 seconds outside timing and does not test 60-second expiry.
All native/lower/upper/work inputs reside on genuine noatime,nosuid,nodev,mode=0700,size=512m tmpfs in a private user/mount/PID namespace. Live mountinfo/device proofs and repeated physical file/directory reads with past atime cover backing including upper/work and establish unchanged atime. Merged NoAtime or future atime alone is not physical proof. RAM-backed evidence does not establish disk-backed performance/durability, VM, pvisor run or review guarantees.
| Evidence | Current-source status |
|---|---|
| Five-condition preflight, n=1/cell | Passed |
| Formal timing, 3 warmups + 30 samples/cell | All three whole cohorts contaminated by concurrent Cargo checks and rejected; accepted=0 |
| P50, time changes and bootstrap 95% CI | Unaccepted; statistics remain empty in all 25 planned cells |
| Independent B-FS-DIAG profile, n=3/case | Valid for request counters only |
The independent profile retains 90 fresh diagnostic cases, 5 persistent correctness processes, 95 logs and 152 unique final instances. Each instance's final cumulative record replaces earlier checkpoints rather than being summed. The table extracts request medians from the derived CSV for three diagnostics per condition; all ranges equal the medians. Warm deltas subtract the independently fresh-mounted prime-only case in the same round. Units are callbacks, with no timing values.
| Operation / counting scope | Condition | LOOKUP | GETATTR | OPEN | READ |
|---|---|---|---|---|---|
| Hot / warm delta | legacy-writable | 0 | 4096 | 4096 | 4096 |
| Hot / warm delta | metadata-writable | 0 | 4096 | 4096 | 4096 |
| Hot / warm delta | metadata-readonly | 0 | 0 | 4096 | 4096 |
| Hot / warm delta | metadata-and-data-readonly | 0 | 0 | 4096 | 0 |
| TTL window / warm delta | legacy-writable | 2192 | 2049 | 4096 | 4096 |
| TTL window / warm delta | metadata-writable | 0 | 4096 | 4096 | 4096 |
| Readsearch / warm delta | metadata-readonly | 0 | 0 | 2048 | 2048 |
| Readsearch / warm delta | metadata-and-data-readonly | 0 | 0 | 2048 | 0 |
| Hot / complete fresh-mount lifecycle | metadata-and-data-readonly | 2192 | 1 | 8192 | 2048 |
Counts support extended TTL avoiding repeated LOOKUP in this window and read-only KEEP_CACHE eliminating warm-operation READ callbacks. Writable Metadata does not eliminate GETATTR/OPEN/READ. The full lifecycle still includes initial reads; zero warm READ does not mean no physical reads or zero task cost. Diagnostic elapsed times do not enter formal distributions, rejected batches are not pooled, and earlier-source noatime performance cannot substitute for current-source acceptance. The separate valid immutable-cache results below retain their original measurement scope.
Formal acceptance status CSV · Independent request counters CSV · Engineering report · Reproduction and evidence contract. Both CSVs are directly copied derived data retaining source/binary digests and statistical scope. Raw samples, logs, frozen sources and receipts stay in benchmark/pvisor/.data/, without site publication or rewriting historical results.
Physical metadata caching for immutable lowers
Same-artifact real Linux FUSE A/B reduced read-heavy median operation time by roughly 24–26%, and fresh-process/mount/tool-through-unmount task time by 19.6%. This is B-FS-ENG engineering evidence, not an order-of-magnitude improvement or proof of equal gains for OCI, VM, full Agent tasks or staged execution with review journals.
Contract and experiment design
Each lower declares LayerMutability::{Mutable,Immutable}, defaulting to mutable. The caller guarantees lifetime stability of contents, metadata, namespace, parent and mount identity, including hardlink aliases. The cache retains successful physical-lower metadata only, bounded to 4096 entries. Upper, higher-priority mutable layers, whiteout/opaque, access policy and first observations remain checked. The kernel's one-second TTL, KEEP_CACHE and read-observation semantics are unchanged.
OCI extraction directories remain host-writable and lazy-image physical projections change on demand, so neither source is automatically promoted. Host rootfs, arbitrary directories and frozen baselines also receive no automatic promise. The experiment uses an exclusively owned, actually stable lower; a read-only mount is not a substitute for ownership.
Measured 2026-10-07 on Ryzen 7 9700X, Linux x86_64 and Btrfs, with driver/tools pinned to CPUs 0,1. Inputs have 2048 files in 32 branches, half deeply nested, totaling about 1.1 MB; host cache is warm. Native, mutable FUSE and immutable cache-off/on use one frozen release driver. Three warmups and 30 measured samples per cell are seeded-shuffled, totaling 600 measured samples with no formal failures. Both immutable arms keep identical declarations, changing only the service cache. No preimage journal is enabled, excluding review/apply cost.
Data and analysis
Milliseconds, P50; changes are relative to same-contract cache-off, with paired-round bootstrap 95% intervals.
| Workload | Native | Mutable FUSE | Cache-off | Cache-on | Time change | 95% interval |
|---|---|---|---|---|---|---|
| Hot metadata/open/read, two passes | 9.34 | 140.01 | 140.86 | 103.96 | −26.20% | [−26.55%, −25.79%] |
| Two passes after TTL expiry | 13.56 | 150.56 | 147.71 | 112.47 | −23.86% | [−25.44%, −22.44%] |
| One open/read/search verification pass | 3.36 | 69.72 | 70.31 | 52.80 | −24.90% | [−25.48%, −24.22%] |
| Git status, rg and content checks on persistent mount | 19.81 | 202.21 | 203.43 | 154.55 | −24.03% | [−24.69%, −22.98%] |
| Fresh process, mount, tools and unmount | 22.66 | 210.76 | 210.49 | 169.28 | −19.58% | [−20.44%, −19.10%] |
Hot traversal has untimed priming. TTL conditions wait 1.1 seconds after priming outside the timer; the second pass may hit kernel cache, so this is not fully cold reading. Writes are correctness probes only, without write-performance claims. All reads verify complete bytes. Append-preserving copy-up, rename, unlink/recreate, whiteout, immediate/after-TTL visibility and exact upper inventories pass; complete lower content, namespace and metadata inventories are unchanged. Inputs do not trigger eviction. Large repositories, concurrency, macOS and guest paths remain unmeasured.
An independent profile has 24 instances, all with final records; instrumentation is excluded from timing. Persistent cache-on reduces physical parent-stat counts by 49.2% and leaf-stat counts by 84.3% versus off, with equal open/read counts. This supports less repeated server resolution, not proof of eliminating all FUSE requests or physical disk reads; inclusive spans are not summed. Cache-on remains substantially slower than native. Long kernel caching, upper consistency and mapping/fault paths need separate validation.
Formal statistics CSV · All-instance counters CSV · Engineering report and reproduction. Frozen sources, build receipts, input inventories, failed preflight, formal samples and independent profiles stay in benchmark/.data/immutable-cache-*, separate from user performance distributions.
Independent counters for pinned artifacts
Measured on 2026-10-06, CPUs 0,1, VM 2 vCPU/16 GiB, with verified frozen CLI, source, tool inputs and firmware. Seven-tool and fixed-repair workloads each run three times in staged/VM modes: twelve valid jobs, zero failures. Complete shared-input byte inventories are identical before and after. Executor-provided TMPDIR is preserved, with a fresh private empty tool cache per task; seven-operation Cargo temporary files and outputs remain in each independent workspace. Diagnostic stderr goes directly to a regular file, avoiding EAGAIN from nonblocking pipes during large profile writes. Profiles and startup timing are enabled; these times do not enter user performance distributions.
Every staged trial has 5/5 final instances, every VM 13/13, totaling 108 across rootfs, workspace and supervisor. Records use PID, component and instance, retaining only each instance's last cumulative snapshot. Frozen source construction order establishes rootfs/workspace scope; matching instance numbers in supervisor and VMM cannot be pooled. Inclusive spans nest and overlap across workers, so they cannot be summed into total runtime or a bottleneck percentage.
| Workload / mode | Filesystem | Metric | Median calls | Median inclusive ms |
|---|---|---|---|---|
| Seven tools / staged | workspace | OverlayCore resolve | 14,978 | 144.67 |
| Seven tools / staged | workspace | OverlayCore observe_read | 4,853 | 162.74 |
| Seven tools / staged | workspace | OverlayCore fingerprint_content | 2,157 | 43.26 |
| Seven tools / staged | workspace | journal sync | 5 | 3.07 |
| Seven tools / VM | workspace | OverlayCore resolve | 15,146 | 234.64 |
| Seven tools / VM | workspace | OverlayCore observe_read | 4,840 | 224.98 |
| Seven tools / VM | workspace | OverlayCore fingerprint_content | 2,157 | 64.13 |
| Seven tools / VM | workspace | journal sync | 5 | 2.12 |
| Seven tools / VM | rootfs | OverlayCore resolve | 6,790 | 184.66 |
| Seven tools / VM | rootfs | virtio-fs LOOKUP | 4,802 | 166.51 |
| Seven tools / VM | rootfs | virtio-fs READ | 6,132 | 643.31 |
| Repair / staged | workspace | OverlayCore resolve | 3,126 | 29.45 |
| Repair / VM | workspace | OverlayCore resolve | 2,858 | 39.80 |
| Repair / VM | rootfs | OverlayCore resolve | 6,672 | 180.76 |
Seven-tool VM dispatch/admission records 1,260.54 ms for rootfs and 898.64 ms for workspace. It surrounds all of service_queues, including inline execution, and is not pure queueing or transport. Corresponding pool_queue_wait spans are 13.62 ms and 4.09 ms; waits from different workers still cannot be summed into task time.
Median fingerprint_bytes is 69,375,893 B for seven tools and 11,286 B for fixed repair, identical in staged/VM modes. The source hashes live-lower content on its first observation; ordinary stat/lookup does not hash regular files, and a frozen baseline skips read journaling. Checkpoint durability moves journal persistence to completion. The current seven-tool workspace journal syncs five times, with roughly 2–3 ms in the displayed sync spans; these counts do not establish per-file preimage fsync as the current dominant cost. This mutable fixture does not validate content-receipt reuse or replace read fingerprints with metadata-only observations.
All six VM diagnostics have zero rootfs CREATE, RENAME and WRITE requests with default scratch, supported by complete final records. Rootfs READ still totals roughly six thousand requests; its spans include service, locking and scheduling and cannot be read as disk or transport wait. Investigate path resolution, read observation, tool loading and cache writes separately. Repair reads hash little data but still incur rootfs resolution; the execution-mapping probe establishes only a short-process mapping-path difference. DAX, long attribute caching and individual functions' causal gains remain unverified, requiring engineering A/B that preserves access/staging semantics and independent formal timing.
The derived counter CSV retains three-run statistics and call ranges per filesystem scope, complete coverage and source digests. Original logs, frozen harness, build receipts and the summary script stay in local .data/. An earlier pipe-captured diagnostic with the same binary had five VM aborts from stderr EAGAIN printing panics; failed evidence is retained and excluded from this table. Regular-file capture is diagnostic only, and differences between capture conditions do not establish performance gains; see the counter manual.
Rootfs requests from the npm compile cache
The seven-tool workload's 537 rootfs renames come from Node/npm compile-cache creation. Linux, CPUs 0,1, guest 2 vCPU/16 GiB; the same frozen CLI, tool inputs and firmware alternate default and disabled caches in seeded randomized order. npm --version and the complete seven-tool workload each use six independent fresh VMs, three per condition: twelve successful VMs with 156 final filesystem instances. Both arms include the same Node status probe and subsequent cache inventory. Profiling and strace are enabled; no formal latency or performance gain is reported.
The table gives median counts across three VMs per condition. Every displayed count has the same minimum, median and maximum. Rootfs and workspace remain separate, identified by PID, component and instance; matching instance numbers in the supervisor and VMM must not be pooled.
| Workload | Node compile cache | Actual cache files | Rootfs CREATE | Rootfs RENAME | Rootfs WRITE |
|---|---|---|---|---|---|
| npm --version | Default enabled | 70 | 70 | 70 | 70 |
| npm --version | Disabled | 0 | 0 | 0 | 0 |
| Seven tools | Default enabled | 537 | 538 | 537 | 623 |
| Seven tools | Disabled | 0 | 1 | 0 | 86 |
The Node API confirms /tmp/node-compile-cache in the default arm and DISABLED in the other. Successful strace renames use the VM's root-upper/tmp/node-compile-cache paths, with counts matching rootfs RENAME, copy-up and actual cache files. Complete-tool outputs, every byte of all 256 written files, unchanged lower inventories and execution records pass validation; shared inputs are identical before and after. Disabling caching is a request-attribution control, not a product optimization or user configuration recommendation. The 537 requests cannot be converted into a verified millisecond gain.
Independent filesystem counters need to cover tool caches as well as workspace writes. Formal comparisons must declare whether caches persist between tasks, whether they start empty and which storage they use. Warm page caches and Node compile caches are separate conditions. Two npm calls within one task may reuse their cache; different backends and tasks must not accidentally share one. An empty private cache in workspace storage is a controlled policy, not a measurement of every executor's default temporary storage.
The derived cache-request CSV gives sample counts, count ranges, final coverage and binary, source, input, tracer and raw-report digests. Original syscalls, status output and audit scripts stay in local .data/, separate from user task latencies.
A separate diagnostic preserving pVisor's default temporary directory uses six fresh VMs, three per condition, with final records for all 78 filesystem instances. Guest statfs returns 0x01021994, confirming actual tmpfs. The enabled arm still creates 537 cache files every time, with zero rootfs CREATE, RENAME and WRITE requests. The disabled arm also has zero of those requests and zero cache files. Complete-tool outputs and written bytes pass validation. This establishes that cache creation can stay in default tmpfs. The older workload's tools_env() replaced the executor-provided TMPDIR with /tmp, moving cache writes into the rootfs overlay. These small instrumented diagnostics do not establish an end-to-end speedup; default temporary storage and the workspace-storage control need separate formal sampling.
The default-temporary-storage request CSV retains independent samples and provenance, without pooling them with the /tmp diagnostic.
FUSE requests and staging service costs
Four host conditions use the same verified pinned CLI and seven-tool inputs: native, direct host, a separately rebuilt passthrough FUSE driver and staged. Four preflights and three randomly interleaved rounds pass, totaling sixteen tasks. Every task's 256 written files are checked byte-for-byte; staged lower paths, modes and contents remain unchanged. Direct execution may rewrite only the fixture's verified toolchain path and refresh Git index stat information, with all indexed paths, modes and object IDs unchanged. Fresh caches preserve executor TMPDIR.
The driver uses the same frozen vendored fuser bytes, release profile, synchronous request loop and one-second TTL, without writeback or keep_cache. It omits OverlayCore, access policy, copy-up and preimage logging, so it is a transport-control lower bound. The following are request-count medians across three independent profiled tasks, excluding preflights:
| Workspace request | Passthrough FUSE | Staged host FUSE |
|---|---|---|
| lookup | 3,059 | 3,057 |
| getattr | 452 | 451 |
| read | 5,014 | 5,014 |
| write | 290 | 290 |
| readdir | 464 | 465 |
These five measured callback classes have similar counts. Staged adds internal service work: 14,975 OverlayCore resolves with a median inclusive span of 143.52 ms, 4,853 read observations with 164.30 ms, and 2,157 content fingerprints with 45.15 ms. They nest and overlap, so they cannot be added or assigned percentages of task time. This supports testing resolution and read-observation costs separately from kernel request traffic. It does not show the passthrough driver offers equivalent semantics or establish a product speedup.
Derived FUSE request and service counters retain count ranges, component/instance scope and CLI, driver, source, input and audit digests. Instrumentation and sampled resource observations prevent these task times from entering user latency tables; unknown process lifetimes remain unknown. Raw evidence stays in .data/; reproduction is documented in the benchmark README.
Stage durability counters
A separate batch uses the same verified CLI and tool inputs with native, strict and checkpoint conditions. Three preflights and three randomized rounds pass, totaling twelve tasks. All staged tasks have the requested policy marker and completed seal, unchanged lower inventories, complete written bytes and five final filesystem instances. The table gives per-task medians across three independent profiled trials; it is not pooled with the FUSE-control batch.
| Journal operation | strict calls | checkpoint calls | strict inclusive ms | checkpoint inclusive ms |
|---|---|---|---|---|
| append | 2,703 | 2,703 | 8.78 | 5.97 |
| transaction | 8,686 | 8,686 | 329.44 | 18.53 |
| sync | 340 | 5 | 313.08 | 3.23 |
On Linux each logged sync span invokes the journal file's sync_all; other directory/file synchronization is outside this counter. Strict has 339–340 such calls per task, checkpoint exactly five. The transaction span includes synchronization, so its time cannot be added to the sync span. This identifies persistence as a substantial strict-mode service cost. Checkpoint still records the same 2,703 appends and checks the completion seal; it permits an unsynced log before completion. These checks do not establish arbitrary crash-window equivalence, and profiled spans do not prove the same reduction in uninstrumented task latency. The engineering runner retains separate timing cohorts, distribution splits and paired intervals for at least thirty rounds.
Derived durability counters include all component instances, count ranges and source/input/audit digests. Raw reports, original stdout/stderr, output inventories and failed publication-audit attempts stay locally under .data/.
Independent executable-mapping diagnostic
Identical ELF, loader and all dynamic-library bytes for rg --version execute through virtio-fs files or executable memfds. Linux, inherited host affinity 0,1, guest configured with 2 vCPU/1 GiB; each condition uses three independent fresh VMs with 50 calls per VM, in randomized interleaved order. All twelve VMs and 600 calls pass output checks; every VM has final records for all 13 filesystem instances. The complete prepared input inventory passes verification before and after execution; retained workspace paths, copy bytes, commands, output and profiles pass an independent audit. Profile stderr is captured directly into a regular file. Build, input, firmware and raw-output digests stay in evidence. These profiled diagnostic runs do not enter user task-performance tables or establish complete descendant lifetime CPU placement.
| Preparation source | Execution mapping | First-exec median ms | Repeated-exec median ms | Repeated-exec major faults |
|---|---|---|---|---|
| Original files | virtio-fs | 6.48 | 5.10 | 37 |
| Original files | memfd | 1.56 | 0.73 | 0 |
| Independent-inode copies | virtio-fs | 7.93 | 5.07 | 37 |
| Independent-inode copies | memfd | 1.27 | 0.73 | 0 |
First-exec statistics use the first call in each of three VMs. Repeated-exec statistics take each VM's median over its remaining 49 calls, then the median across three VMs; calls are not independent samples. Both arms copy and hash-check identical inputs and inherit the same fds; guest /dev/shm remains noexec. Original preparation prewarms original inodes; duplicate preparation reads identical bytes from separate inodes. Common Python preparation still warms its interpreter and some libraries, so this is not completely cold startup.
The repeated-exec mapping gap is about 4.4 ms, accompanied by major faults changing from 37 to zero. This supports investigating executable mapping and fault service first. Major faults do not equal physical disk reads. The substitution changes file mapping, path access and loader request paths together; it cannot attribute the whole gap to FUSE transport or missing DAX, or extrapolate gains by multiplying a complete Agent task's process count. Production changes need to preserve access policy, staging observations and evidence semantics before independent formal timing.
Derived execution statistics CSV · Provenance and measurement boundaries CSV. Raw reports, per-VM output, audit and the publication script stay in local benchmark/.data/.
Apply planning and target durability
CLI-only release builds share a frozen parent source; only the apply implementation differs in executed code. The compiler and features, profiles and rustflags of all 292 dependency compilation units match. CPUs 0,1, warm host caches, three warmups and 30 formal measurements per cell, randomized alternating order, independent target/stage per run; preparation is outside the apply timer. These 240 valid samples have profiling and strace disabled; changed files share one directory.
| Files | Operation | Baseline P50 ms | Directory-index P50 ms | Paired-bootstrap 95% difference interval ms |
|---|---|---|---|---|
| 1,000 | Apply | 962.12 | 944.09 | −51.16 to −2.72 |
| 1,000 | Conflict before apply | 46.07 | 21.98 | −24.75 to −22.98 |
| 10,000 | Apply | 13,130.25 | 11,031.86 | −2,461.98 to −1,790.97 |
| 10,000 | Conflict before apply | 2,651.01 | 189.78 | −2,474.89 to −2,448.60 |
The frozen harness checks complete original, staged and final contents at runtime, then deletes generated workspace/upper files. Independent post-run checks cover retained builds, commands, exit codes, conflict output and committed ledgers; they do not independently recheck deleted final files. Conflict before apply does not test concurrent external writes during apply or crash recovery. This engineering A/B is not a comparison against Git or other products.
A separate profile/strace diagnostic has three trials per cell and 24 valid commands, retaining complete exit records and classifying calls by fd paths. Both variants have identical synchronization counts:
| Files applied | Target-file fsync | Target-directory fsync | Stage fsync | Other fsync | Total |
|---|---|---|---|---|---|
| 1,000 | 1,000 | 1,003 | 18 | 1 | 2,022 |
| 10,000 | 10,000 | 10,003 | 18 | 1 | 20,022 |
All these calls are zero for conflict-before-apply commands. The directory index improves planning without reducing target-durability calls; applying 10,000 files still takes about 11 seconds. Batching synchronization per unique directory at transaction boundaries merits a separate experiment, after verifying Prepared, TargetApplied and Committed durability ordering, crash recovery and concurrent external-edit protection. Counts establish call volume, not its share of all remaining time. Tracing perturbs durations; they cannot be added to nested profile spans or used in the formal benefit table.
Formal statistics CSV · Paired differences CSV · Synchronization counts CSV · Provenance and audit scope CSV. Raw records and publication scripts stay in local benchmark/.data/.
Retained independent engineering experiments
The new default-release local VM completes at P50 4.15 s (+3.3% versus optimized v3), with traversal at 157.57 ms (-6.5%). Warm lazy-image open/read improves 8.6% and 64 MiB reads improve 6.6%, but traversal slows and copy-up takes about 2.5× as long. This batch shows no general end-to-end acceleration; see the new-version evaluation for complete distributions and cache conditions.
Motivation
Agents repeatedly list, search and modify files. Tool time and full job time together show the cost of choosing staging or a VM.
Experiment design
The latest batch randomizes native and both versions of staged and libkrun VM. Historical matrices also include host, safe, Docker, rootless Podman/crun and pVisor OCI. Cells usually have 3 warmups and 30 measurements with warm host caches; the complete Ubuntu follow-up uses N=10, labeled separately. Image/input preparation is excluded. Worker time includes tool execution and validation; wall time includes launch and teardown. metadata/git/rg use 2,048 files in 32 directories; read validates a 64 MiB hash. product-v1 and the complete tool environment both write 256×64 KiB files, totaling 16 MiB; each cohort remains separate by configuration. cargo builds 64 dependency-free modules and verifies 2016. npm installs 32 local packages offline, without registry access.
macOS
These workloads were measured on Linux; macFUSE/FSKit overhead and capacity remain unmeasured. Existing macOS/HVF results are retained in VM startup and VM memory, and are not substituted for this workload.
Linux: evaluation after the shared filesystem service refactor
The frozen new source retains host FUSE while local, staged and lazy VM views enter the shared service through virtio-fs. Lazy images no longer create an intermediate host FUSE mount. The implementation still keeps protocol state in the two adapters; DAX, writeback and long attribute TTLs remain disabled.
Comparison and measurement scope
The baseline is the final optimized v3 artifact from the earlier five-item campaign, including path indexing, lazy directory allocation and queue changes; it is not a pre-P0 version. The new integrated worktree was frozen before building, with source and executable hashes recorded. Concurrent cluster/service changes are also present, so this is a version-artifact comparison, not an attribution to one function or solely to removing FUSE.
Both artifacts use identical firmware and complete tool fixtures, 2 vCPU/4 GiB and physical cores 0,1. Both staged variants must report rootless_process with read/write isolation. Each cell has one correctness preflight, three warmups and 30 measurements; preflight and warmups are excluded. Five cells shuffle each round and seven tools run in their fixed order. These workloads use local rootfs, which already had no intermediate host FUSE, making a separate lazy-image measurement necessary. Host caches are warm and CPUs are not exclusive. Release one-minute host load is 1.37 → 2.27; independent batches are not pooled.
Default release: complete local-rootfs workloads
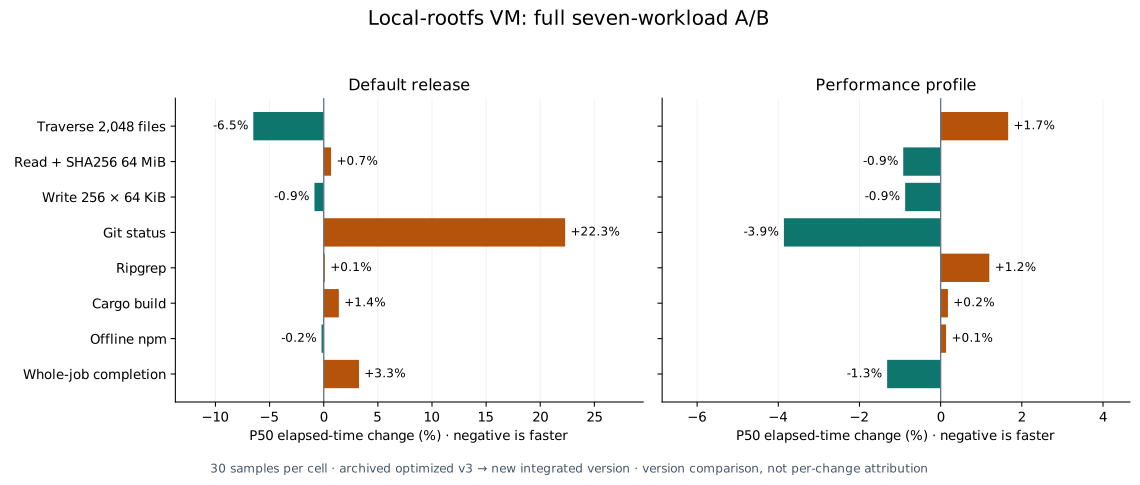
P50 values below are milliseconds; negative changes mean less time. All 150 jobs and 1,050 tool measurements passed existing output, Run Bundle, untouched-lower and complete 256-file upper checks. Both release artifacts use the same size-oriented opt-level=z build.
| Operation | Native | Host staged before → after | VM before → after | VM change |
|---|---|---|---|---|
| metadata | 4.58 | 76.14 → 76.29 | 168.53 → 157.57 | -6.5% |
| read | 32.21 | 65.65 → 66.18 | 116.12 → 116.91 | +0.7% |
| write | 3.60 | 200.70 → 200.46 | 245.18 → 243.09 | -0.9% |
| git | 13.79 | 165.87 → 165.75 | 359.63 → 439.83 | +22.3% |
| rg | 6.84 | 89.95 → 90.46 | 448.42 → 448.88 | +0.1% |
| cargo | 46.49 | 102.49 → 102.65 | 488.15 → 494.97 | +1.4% |
| npm | 163.74 | 250.12 → 250.71 | 1337.35 → 1334.66 | -0.2% |
| Launch to exit | 426.43 | 1240.79 → 1242.06 | 4021.54 → 4152.52 | +3.3% |
New VM traversal P50 decreases 6.5%, but completion increases 3.3% and Git increases 22.3%. Host staged completion changes only +0.1%. This batch does not show general local-rootfs acceleration. Relative to its native control, the new VM takes approximately 34.4× for traversal, 67.5× for small-file writes, 3.6× for 64 MiB reads and 8.2× for npm. Small-file and metadata costs remain substantial.
| Operation | VM before → after P95 | VM before → after P99 |
|---|---|---|
| metadata | 199.59 → 199.24 | 208.31 → 201.96 |
| read | 120.75 → 134.33 | 123.49 → 141.60 |
| write | 260.44 → 269.16 | 262.67 → 272.02 |
| git | 719.48 → 723.31 | 738.35 → 746.02 |
| Launch to exit | 4384.50 → 4406.12 | 4550.35 → 4469.82 |
Traversal tails decrease slightly, while read/write tails increase. Completion
P95 is close and P99 decreases slightly. With 30 samples P99 is sensitive to
individual jobs; median or isolated tail changes do not establish stable gains.
The Local raw record docs/src/assets/benchmarks/.data/filesystem-service-20261005/local-release.tsv
retains all seven worker timings and launch-to-exit time for every job.
Performance artifacts: local comparison with matched build settings
A separate complete batch has 150 jobs and 1,050 tool measurements, all passing correctness and isolation checks. Baseline and new versions both use opt-level=3. Host load is 0.93 → 3.87 and CPUs are not exclusive. Values are P50 milliseconds. Distributions are not pooled with release, and the new 4.15/3.81 s across those batches is not a causal build-optimization measurement.
| Operation | Native | Host staged before → after | VM before → after | VM change |
|---|---|---|---|---|
| metadata | 4.59 | 67.30 → 67.91 | 146.11 → 148.54 | +1.7% |
| read | 32.12 | 65.60 → 65.41 | 116.28 → 115.21 | -0.9% |
| write | 3.68 | 196.60 → 195.74 | 233.49 → 231.45 | -0.9% |
| git | 14.12 | 156.56 → 155.28 | 345.22 → 331.88 | -3.9% |
| rg | 6.99 | 80.93 → 81.58 | 389.81 → 394.48 | +1.2% |
| cargo | 47.14 | 103.71 → 101.63 | 459.17 → 460.00 | +0.2% |
| npm | 166.44 | 254.44 → 252.32 | 1236.33 → 1237.97 | +0.1% |
| Launch to exit | 430.56 | 1187.74 → 1186.28 | 3860.30 → 3809.40 | -1.3% |
New VM completion changes -1.3%, Git -3.9% and metadata +1.7%, with smaller median changes elsewhere; host staged completion changes -0.1%. Release completion +3.3% versus this batch's -1.3% is inconsistent with general acceleration. Current performance VM traversal is about 32.4× its same-batch native control, small-file writes 62.8×, reads 3.6× and npm 7.4×. The new performance binary is 19.38 MiB, versus release 14.99 MiB, approximately 29.3% larger.
| Operation | VM before → after P95 | VM before → after P99 |
|---|---|---|
| metadata | 272.19 → 250.74 | 294.65 → 429.29 |
| read | 263.26 → 239.29 | 336.18 → 308.37 |
| write | 740.64 → 559.34 | 970.78 → 797.87 |
| git | 1096.91 → 1071.94 | 1158.24 → 1095.24 |
| Launch to exit | 9616.95 → 7328.27 | 9971.15 → 10148.77 |
The Local raw record docs/src/assets/benchmarks/.data/filesystem-service-20261005/local-performance.tsv
retain every sample. The two figure panels are independent batches, each
comparing old/new artifacts with matched build settings. They are not a same-batch
release/performance A/B or individual-mechanism gains.
Lazy images: cold/warm comparison without intermediate host FUSE
Both artifacts use performance builds (opt-level=3) and read the same immutable rootfs through a local Unix-socket cache-v1 fixture. The Python cache server responds and verifies content hashes on separate physical cores 2,3; VM and runner use 0,1. No artificial latency is added. This is not a WAN, TCP/S3, registry-download or production Rust cache-server throughput measurement. One-minute host load is 1.00 → 1.85.
Each round shuffles version order, running cold then warm for each version. Cold uses fresh client content/metadata caches; warm reuses those disk caches but starts a new guest, backend projection and upper. Host page caches are not evicted. After tool startup the script waits a fixed 1.2 s, then measures first and immediate repeat traversal, first and immediate repeat open/read, 64 MiB SHA256 and 32 file copy-ups. “Immediate repeat” describes order, not guaranteed kernel cache hits: the default TTL can expire during long operations. The wait is excluded from workers and included in launch-to-exit, diluting whole-job percentage changes.
Four cells have three warmups and 30 measurements each, plus preflight: 120 jobs and 720 operation measurements. The 2,048 small files occupy 32 directories and contain 1,023 bytes each; 32 copy-up files are rewritten to 17 bytes and verified. All guest content/attribute, Run Bundle VM isolation, staged workspace-write and immutable-source checks pass. Mount monitoring observed host FUSE in all 60 baseline measurement jobs and no FUSE mount in the image store of all 60 new jobs.
Values below are P50 milliseconds; negative means less time.
| Operation | Cold before → after | Change | Warm disk cache before → after | Change |
|---|---|---|---|---|
| First traversal of 2,048 files | 257.74 → 285.25 | +10.7% | 223.41 → 254.04 | +13.7% |
| Immediate repeat traversal | 41.21 → 54.63 | +32.6% | 42.43 → 54.69 | +28.9% |
| Open/read/close 2,048 files | 823.29 → 795.42 | -3.4% | 637.58 → 582.75 | -8.6% |
| Immediate repeat open/read | 671.61 → 686.14 | +2.2% | 740.57 → 695.84 | -6.0% |
| 64 MiB read + SHA256 | 189.80 → 185.68 | -2.2% | 124.72 → 116.43 | -6.6% |
| Copy up and verify 32 small files | 28.30 → 73.41 | +159.4% | 28.83 → 72.56 | +151.7% |
| Launch to exit (includes 1.2 s wait) | 3596.20 → 3678.45 | +2.3% | 3314.47 → 3335.84 | +0.6% |
Reads improve locally: warm-cache open/read/close decreases 8.6%, and 64 MiB reads decrease 6.6%. First traversal instead increases 10.7%/13.7% for cold/warm caches, immediate repeat traversal increases 32.6%/28.9%, and copy-up takes 2.5–2.6× as long. Whole-job P50 changes +2.3% cold and +0.6% warm, without overall acceleration. A shorter call chain does not automatically remove metadata projection, content materialization, preimage recording and synchronization costs. This batch does not separately profile those costs or attribute a regression to one specific mechanism.
Every cold job downloads the same fixture data in both versions: 2,112 content reads and 69,203,968 bytes, comprising 2,048 small files and 64 large-file blocks. Including the interpreter and other rootfs content gives 2,164 reads and 86,924,150 bytes. Both warm versions download zero content and perform no remote stat/list queries. Differences are not due to extra prefetching or omitted data validation in the new version.
| Operation | Warm before → after P95 | Warm before → after P99 |
|---|---|---|
| First traversal of 2,048 files | 230.50 → 262.88 | 233.89 → 264.27 |
| Open/read/close 2,048 files | 643.50 → 599.41 | 644.50 → 633.51 |
| 64 MiB read + SHA256 | 126.19 → 119.56 | 126.61 → 119.89 |
| Copy up and verify 32 small files | 29.02 → 79.89 | 29.43 → 81.43 |
| Launch to exit (includes 1.2 s wait) | 3335.95 → 3377.97 | 3350.71 → 3438.46 |
Warm read tails improve in some cases; metadata/copy-up and whole-job tails
increase. Baseline cold open/read P99 of 1,628.39 ms and completion P99 of
4,406.78 ms are affected by one slow job; the new values are
804.34/3,736.05 ms. Selecting only those tails would not establish stable gains.
Local raw record docs/src/assets/benchmarks/.data/filesystem-service-20261005/lazy-performance.tsv
are retained. The first preflight failed because the script misstated fixture
byte size; corrected preflight and formal results are stored separately, with
that failure excluded from timing distributions.
Linux: retained results of the earlier five-item optimization campaign
These independent earlier batches produced this campaign's baseline artifacts. Their percentage changes cannot be added to the new results; the historical 16 GiB VM's 5.27 s versus the new 4.15 s is not solely a refactor gain. Final v3 combines path indexing, lazy directory allocation, queue changes and related work, with 2 vCPU/4 GiB, three warmups and 30 measurements per cell. It does not attribute gains to each mechanism. The mutable fixture does not quantify immutable-image receipt reuse.
| Comparison | VM P50 before → after | Change |
|---|---|---|
| Combined code changes, release: completion | 4,416.25 → 4,236.61 ms | -4.1% |
| Same batch: metadata | 194.21 → 169.20 ms | -12.9% |
| Same batch: npm | 1,504.83 → 1,395.37 ms | -7.3% |
| Same-source release → performance: completion, separate batch | 4,233.32 → 3,839.44 ms | -9.3% |
Combined release completion P95 changes +2.4% and Git P99 +25.5%;
separate performance completion P95/P99 change -7.9%/-6.9%. These tradeoffs
cannot be pooled into one speed curve. The Local raw record docs/src/assets/benchmarks/.data/filesystem-optimizations-20261005/code-v3-4g.tsv,
Local raw record docs/src/assets/benchmarks/.data/filesystem-optimizations-20261005/profile-v3-4g.tsv
and Local raw record docs/src/assets/benchmarks/.data/filesystem-optimizations-20261005/manifest.tsv
retain full provenance. Kernel-mechanism and P0 batches below are also historical.
Linux: full kernel-mechanism and concurrency evaluation
Screening precedes the unchanged seven-tool evaluation below. These are real filesystem jobs, not extrapolated adapter timings or three-sample screens. Retained changes fuse parent statx queries, share the lock for read-only OPEN, and add opt-in lock/pool diagnostics with no clock reads when disabled. READDIRPLUS_AUTO and inline metadata dispatch remain; DAX, writeback and long-lived caches are not enabled.
Completed experiments
| Experiment | Samples and measurement boundary | Results |
|---|---|---|
| Real KVM / host FUSE screening | Five candidate comparisons, each with five cells, one warmup and three measurements per cell; includes reruns after implementation corrections | Screening and decisions, Local raw record docs/src/assets/benchmarks/.data/filesystem-kernel-20261005/process.tsv |
| Release adapter microbenchmarks | Four lookup/getattr/open/directory PLUS workloads, two warmups and eight measurements per case and artifact; no VM, FUSE mount or preimage journaling | Local raw record docs/src/assets/benchmarks/.data/filesystem-kernel-20261005/micro-final.tsv |
| Cache, concurrency and guest tmpfs controls | Three measurements for traversal and single/four-thread stat; one for partial writes and readback on 64 files | Control results, Local raw record docs/src/assets/benchmarks/.data/filesystem-kernel-20261005/kernel-probe.tsv |
| Same-source full seven-tool A/B | Five cells, three warmups and 30 measurements per cell; 150 jobs and 1,050 tool measurements | Full distributions and conclusions |
| Same-batch full comparison of published P0 and final candidate | Five additional cells, three warmups and 30 measurements per cell; 150 jobs and 1,050 tool measurements; source and staged isolation types differ | Historical-artifact rerun |
| Separate profiling and OPEN concurrency regression | One profile measurement per cell, excluded from acceptance timings; regression checks old blocking behavior, new read-only concurrency and retained writable exclusion | Queue and lock diagnostics, implementation and regression |
The five cells are native, baseline/candidate host FUSE staged, and baseline/candidate KVM VM. The earlier P0 modification's N=30 A/B remains separate, outside the latest two rounds' 300 measured jobs. DAX, writeback cache, FUSE passthrough, FUSE-over-io_uring, long-lived TTLs and replacement with virtiofsd have only been assessed for feasibility; no performance A/B has been implemented for them.
Screening and implementation selection
Each real screen uses five cells, one warmup and three measurements per cell, frozen source, firmware and fixtures, with mandatory preflight. Combined variants are labeled; separate batches are not single-change comparisons. Screens select further work, not tail or whole-task performance claims.
| Candidate | VM traversal P50 change | VM completion P50 change | Decision |
|---|---|---|---|
| Initial fused statx | +4.8% | +5.9% | Missing upper parents still triggered duplicate fallback queries; fix and rerun |
| OPEN shared lock + metadata pool on statx | +1.4% | +8.2% | Do not promote this combination; npm +21.8% in this screen |
| Force READDIRPLUS, disable AUTO | -30.6% | +4.5% | Git +93.6%; do not enable globally |
| Fused statx + shared OPEN lock before correcting namespace-error fallback | -17.7% | +4.2% | Intermediate version; retain records, correct and rerun |
| Corrected statx + shared OPEN lock | +5.0% | +1.0% | Correctness passes; use full N=30 for evaluation |
Initially ordinary ENOENT/ENOTDIR also fell back from statx to metadata, offsetting some savings on lower queries. The final implementation returns those namespace results directly. Unsupported/restricted queries or missing fields fall back safely, with no guessed mount ID or native parent reuse. Physical ancestor and leaf checks remain, without cross-request attribute or permission caching.
A separate release adapter microbenchmark uses two warmups, eight measurements and one separate diagnostic per case, without VM, FUSE or preimage journaling. Deep-directory P50 is 97.52 → 88.16 ms (-9.6%); shallow lookup/open/getattr 28.39 → 27.61 ms (-2.8%). The final normal fixture has no metadata fallbacks and avoids 33,664 separate mount-identity queries in the deep case. This verifies reduced duplicate work, not a predicted VM-task gain.
The new regression reproduces read-only OPEN waiting behind independent backing READ: it fails the old implementation and passes the shared-lock implementation. Writable OPEN still waits and lower content stays unchanged. APPEND/TRUNC, non-read-only and kill_priv opens, mutations, release and snapshots remain exclusive. Per-path journals still synchronize first observations; handle, descriptor RAM-lease, used-ring and freeze-drain contracts remain. All five implementation-file hashes match the actual worktree.
Same-source full seven-tool A/B
Both release binaries use frozen bc08f457 source, differing by the retained
implementation patch. Each cell has three warmups and 30 measurements:
150 measured jobs and 1,050 tool measurements, all passing original output,
Run Bundle, isolation, lower-write absence and complete 256-file upper checks.
Each job has a fresh workspace/upper and runs the seven tools in their original
order; five cells shuffle with a fixed seed. The retained fixture still writes
256 × 64 KiB, checks 64 MiB and traverses 2,048 files with the original cargo/npm
inputs. Host cache is warm; affinity uses physical cores 0,1, VM 2 vCPU/16 GiB,
and firmware matches P0. Both same-source staged variants are
rootless_process, requiring read/write/non-bypassable boundaries. Published
P0 staged used host_process; its comparison is separate. CPUs are not exclusive;
host one-minute load is 2.02 → 2.70. Units below are ms; negative is faster.
| Workload | Native | Staged before → after | Change | VM before → after | Change |
|---|---|---|---|---|---|
| metadata | 4.88 | 77.96 → 78.14 | +0.2% | 188.38 → 194.35 | +3.2% |
| read | 32.62 | 69.39 → 68.94 | -0.7% | 154.14 → 156.15 | +1.3% |
| write | 3.89 | 202.64 → 202.92 | +0.1% | 252.50 → 254.62 | +0.8% |
| git | 15.13 | 172.44 → 173.35 | +0.5% | 493.02 → 433.31 | -12.1% |
| rg | 7.76 | 90.78 → 91.63 | +0.9% | 457.09 → 452.03 | -1.1% |
| cargo | 55.25 | 116.54 → 114.56 | -1.7% | 734.07 → 719.18 | -2.0% |
| npm | 175.58 | 267.20 → 263.22 | -1.5% | 1631.39 → 1625.45 | -0.4% |
| launch to exit | 468.52 | 1345.29 → 1310.05 | -2.6% | 5298.80 → 5273.93 | -0.5% |
The full run does not establish universal acceleration. Staged completion is -2.6%, VM completion -0.5%; VM Git is -12.1% in this batch, while metadata is +3.2%. The adapter's -9.6% must not be reported as VM traversal improvement, and Git cannot stand in for npm, writes or the complete task.
| Workload | Staged P95 before → after | VM P95 before → after | Staged after P99 | VM after P99 |
|---|---|---|---|---|
| metadata | 84.63 → 88.98 | 254.15 → 270.13 | 97.68 | 296.52 |
| read | 85.22 → 85.02 | 197.53 → 201.65 | 86.04 | 214.19 |
| write | 222.86 → 222.09 | 330.15 → 295.80 | 228.31 | 335.81 |
| git | 206.08 → 197.27 | 814.82 → 776.87 | 226.71 | 796.34 |
| rg | 96.04 → 98.05 | 478.63 → 531.83 | 101.09 | 660.30 |
| cargo | 147.37 → 144.05 | 812.44 → 831.76 | 150.25 | 846.64 |
| npm | 297.90 → 294.31 | 1909.17 → 1947.07 | 306.96 | 2093.77 |
| launch to exit | 5633.02 → 3808.26 | 5812.36 → 5766.30 | 5321.95 | 6031.76 |
Tails do not improve together. Candidate VM rg P99 goes 526 → 660 ms, npm 2001 → 2094 ms, completion 5917 → 6032 ms, while write tails fall. Staged completion tails include a few slow tasks and are not the sum of seven worker times. All distributions remain available; this is one full batch on a nonexclusive host.
Against same-batch native, candidate VM traversal is 39.8×, 256-file writes 65.4×, 64 MiB reads 4.8×, npm 9.3×. Repeated directory/attribute operations, small writes and VM tool execution remain substantial costs.
Published P0 artifact rerun in the same batch
The published pinned P0 candidate (a1020d4b plus shared stdio readiness fix)
is then compared with final P1: again three warmups and 30 measurements per cell,
an additional 150 measured jobs and 1,050 tool measurements, all passing
the same checks. Original fixture, firmware and two-core budget remain; load is
0.45 → 3.44. Units are ms. This is a same-batch artifact comparison with
different source bases, not attribution of every difference to statx or OPEN.
P0 staged is host_process, P1 rootless_process; each observed boundary
is validated strictly.
| Workload | P0 → P1 staged P50 | Change | P0 → P1 VM P50 | Change |
|---|---|---|---|---|
| metadata | 76.26 → 77.26 | +1.3% | 225.02 → 228.47 | +1.5% |
| read | 68.11 → 68.69 | +0.9% | 121.06 → 120.93 | -0.1% |
| write | 198.12 → 200.20 | +1.0% | 240.25 → 253.10 | +5.3% |
| git | 167.50 → 170.04 | +1.5% | 449.65 → 430.24 | -4.3% |
| rg | 89.01 → 89.85 | +0.9% | 465.98 → 460.27 | -1.2% |
| cargo | 111.08 → 111.62 | +0.5% | 654.27 → 625.52 | -4.4% |
| npm | 215.91 → 261.39 | +21.1% | 1662.16 → 1666.95 | +0.3% |
| launch to exit | 1224.50 → 1290.69 | +5.4% | 5164.78 → 5187.46 | +0.4% |
Second-batch VM completion is +0.4%, again without overall acceleration; Git is -4.3%, writes +5.3%. Staged npm is +21.1%, versus -1.5% in the previous same-source rootless comparison. Different execution boundaries and other source changes enter this artifact comparison; it is not a causal claim about the filesystem patch. The same P1 artifact traverses in 194 / 228 ms and reads in 156 / 121 ms across the two batches, demonstrating batch sensitivity. Neither faster-batch selection nor percentile pooling is valid.
Original P0 published traversal 195.24 ms remains below; the identical P0 artifact measures 225.02 ms here. Published-to-current differences likewise cannot be equated with code gains. Both complete evaluations total 300 measured jobs and 2,100 tool measurements. Evidence supports eliminating duplicate parent queries and read-only OPEN serialization, not universal end-to-end acceleration.
Local raw record docs/src/assets/benchmarks/.data/filesystem-kernel-20261005/full-historical.tsv ·
Local raw record docs/src/assets/benchmarks/.data/filesystem-kernel-20261005/historical-summary.tsv ·
Local raw record docs/src/assets/benchmarks/.data/filesystem-kernel-20261005/samples.csv
Cache, concurrency and guest-local controls
The separate diagnostic repeats traversal of the same 2,048-file fixture,
waiting 1.2 seconds before every expired-cache pass, including after the initial
rglob. Candidate VM results below are in ms. Tmpfs is verified as /dev/shm
inside the same guest; file preparation is excluded.
| Control | Measurements per group | P50 |
|---|---|---|
| Expired-cache traversal → immediate repeat | 3 | 233.11 → 105.11 |
| Single-thread → four-thread partitioned stat | 3 | 164.17 → 91.86 |
| Traversal on tmpfs in the same guest | 3 | 3.28 |
| 64 files, eight 1 KiB writes each with readback: shared view → guest tmpfs | 1 | 69.64 → 2.78 |
Immediate repetition shows caching helps, with substantial cumulative cost remaining. Overlapping submission reduces waits without proving concurrent Core execution. The partial-write control has one sample and is not acceptance evidence. Tmpfs excludes virtio-fs, Core, journal and storage latency together; the difference cannot all be attributed to transport.
A separate profile batch is excluded from acceptance timings. Last candidate VM checkpoints show 21,340 / 24,743 inline and 357 / 65 pool requests. Pool queue waits total 12.80 / 1.67 ms; completion-to-used-ring publication 5.16 / 1.22 ms. Combined read/write lock acquisition waits are about 1.09 / 2.55 ms, with individual maxima below 0.38 ms. This diagnostic does not show long lock waits, but excludes guest-to-host admission waiting and does not rule out inline serialization. Core checkpoints still show 121,768 / 169,649 parent observations and 63,375 / 65,488 fused statx queries, with no fallback records. Complete staged profiling records 341 journal fsync calls totaling about 119 ms. VM checkpoints are not final and may have different cutoffs. Inclusive spans are not summed; counters are not a complete syscall census.
The initial diagnostic stopped because it searched runs only, while --stage places the Run Bundle in stage. The failed batch is retained and corrected runs use new directories. The intermediate successful batch did not expire initial rglob caches; it is kept separately, excluded from final diagnostic timings. All normal staged writes remain in upper, with lower unchanged.
Priorities for further kernel mechanisms
- Directory/attribute/negative caches and invalidations. Repeated traversal remains expensive. Establish immutable or single-owner tree contracts before testing longer TTL and FOPEN_CACHE_DIR. Live lowers allow external host changes, and no active invalidation transport exists; do not extend TTL globally.
- Workload-aware READDIRPLUS and host concurrency. AUTO already exists, and forced PLUS has tradeoffs. Host fuser uses one synchronous callback loop. VM uses one request and one hiprio queue; short metadata runs inline, and a full pool pauses normal admission. More workers alone do not prove gains; measure queue/lock waits. ASYNC_READ/PARALLEL_DIROPS are already negotiated by the protocol server.
- Writeback cache. It may coalesce small writes, but requires durable preimages before mutation, dirty-page draining before terminal/export/snapshot, and partial-write/append/truncate correctness. Kernel I/O modes
- Data paths and local filesystems. DAX primarily removes data copies; no DAX A/B is performed here. FUSE-over-io-uring addresses host /dev/fuse, not direct replacement of VM virtqueues. FUSE passthrough needs a backing FD in the same kernel, not a host FD handed to the guest. Guest-local tmpfs or read-only block images/kernel filesystems merit separate evaluation with staging/recording/restore contracts preserved. DAX · io-uring · Passthrough
Validation passes: 97 Core tests (five skipped), 12 overlayfs tests, 294 VM tests (two skipped), 25 benchmark tests, all-targets Clippy for three relevant packages and benchmark Ruff. No semspec ledgers/snapshots were modified or approved. Evidence includes samples and failures, not only successful summaries. These numbers do not update macOS, startup, networking or complete Agent-loop measurements.
Local raw record docs/src/assets/benchmarks/.data/filesystem-kernel-20261005/full-same-source.tsv ·
Local raw record docs/src/assets/benchmarks/.data/filesystem-kernel-20261005/summary.tsv ·
Local raw record docs/src/assets/benchmarks/.data/filesystem-kernel-20261005/process.tsv ·
Local raw record docs/src/assets/benchmarks/.data/filesystem-kernel-20261005/micro-final.tsv ·
Local raw record docs/src/assets/benchmarks/.data/filesystem-kernel-20261005/kernel-probe.tsv ·
Local raw record docs/src/assets/benchmarks/.data/filesystem-kernel-20261005/profiles.tsv ·
Local raw record docs/src/assets/benchmarks/.data/filesystem-kernel-20261005/implementation.patch ·
Local raw record docs/src/assets/benchmarks/.data/filesystem-kernel-20261005/evidence.tar.gz ·
Local raw record docs/src/assets/benchmarks/.data/filesystem-kernel-20261005/manifest.tsv
Linux: 2026-10-05, P0 real VM/FUSE A/B baseline
This batch boots actual KVM VMs and mounts actual host FUSE, completing the
end-to-end check missing from the adapter experiment. Host devices are available;
the initial sandbox hid /dev/kvm and /dev/fuse. Both GNU/Linux release binaries
come from the same a1020d4b source archive and differ only in OverlayCore's
core.rs. Both include the same guest stdio readiness fix. Binary, firmware,
source patch and harness hashes are retained.
“After” means this pinned candidate artifact, measuring the incremental benefit of skipping marker probes for an unavailable upper. Other optimizations already in the archive are shared by both binaries and are outside the A/B difference; later commits do not automatically enter these measurements.
Each round shuffles five cells: native and both versions of FUSE staged and VM.
Each cell has three warmups and 30 measurements: 150 measured jobs and 1,050 tool
measurements, all correct. Every job has a fresh workspace/upper and executes the
seven workloads in order in one environment. Fixture copying is excluded. Host
caches are warm; all launch trees use physical host cores 0,1; VMs have 2 vCPU
and 16 GiB. The pinned historical fixture and product-v1 workload both write
256×64 KiB (16 MiB). Historical percentiles are not pooled. Concurrent
host activity remained: one-minute load average fell from 10.38 to 3.06. Affinity
is a shared execution budget, not exclusive CPUs. This is one screening batch.
Tool operation and validation P50 in ms; negative changes mean less elapsed time:
| Workload | Native | FUSE before→after | Change | VM before→after | Change |
|---|---|---|---|---|---|
| metadata | 4.93 | 92.38 → 78.25 | -15.3% | 224.36 → 195.24 | -13.0% |
| read | 32.56 | 68.30 → 67.82 | -0.7% | 116.98 → 117.90 | +0.8% |
| write | 3.90 | 201.36 → 198.92 | -1.2% | 243.10 → 257.16 | +5.8% |
| git | 15.11 | 190.36 → 170.46 | -10.5% | 484.14 → 494.86 | +2.2% |
| rg | 7.66 | 100.80 → 90.58 | -10.1% | 476.92 → 464.97 | -2.5% |
| cargo | 52.92 | 112.30 → 110.11 | -1.9% | 513.46 → 512.74 | -0.1% |
| npm | 173.19 | 221.67 → 217.47 | -1.9% | 1570.05 → 1503.67 | -4.2% |
Launch-to-exit P50 for the seven-workload job is 454.50 ms native, 1288.69 → 1230.93 ms (-4.5%) FUSE staged and 4829.04 → 4777.55 ms (-1.1%) VM. Metadata savings reproduce in the actual paths. This does not establish improvements for VM git, writes or overall jobs: VM write and git became slower in this batch. Small changes and write behavior need a quieter-host rerun; a single P50 cannot establish their cause.
P95 and remaining costs
P95 from the same samples, in ms. Lower medians did not consistently produce lower tail latency:
| Workload | FUSE before→after P95 | Change | VM before→after P95 | Change |
|---|---|---|---|---|
| metadata | 112.02 → 107.34 | -4.2% | 344.81 → 322.87 | -6.4% |
| write | 312.85 → 300.82 | -3.8% | 349.50 → 780.11 | +123.2% |
| git | 294.83 → 378.19 | +28.3% | 892.72 → 1181.58 | +32.4% |
| rg | 153.51 → 172.53 | +12.4% | 604.35 → 850.17 | +40.7% |
| Whole job, launch to exit | 2078.80 → 2152.45 | +3.5% | 6796.10 → 8565.53 | +26.0% |
Candidate staged / VM whole-job P99 is 13.36 s / 10.46 s, also retained in the raw summary. With N=30, a few slow samples influence the tail, and concurrent host load remains uncontrolled. These observations need reproduction before attributing them to an implementation change. Evidence supports metadata-path improvement; overall performance acceptance still needs repeated quieter-host batches.
Against same-batch native, candidate staged / VM metadata still takes 15.9 / 39.6 times as long, adding 73 / 190 ms per traversal. Writing 256 files still takes 199 / 257 ms, versus 3.90 ms native. VM offline npm takes 1.50 s, versus 0.17 s native. Repeated traversal, small-file writes and VM tool execution remain the next optimization targets.
An earlier warmup exited zero and completed writes without any workload stdout markers. The harness stopped and retained the failure. The ordinary VM runner now declares the named ports required by its actual non-terminal standard descriptors. The guest waits for their names before launching tools, failing after at most five seconds. Regression tests cover delayed names, later port creation and absent ports; there is no unconditional startup delay. All 68 VM runs in the formal batch, including preflight and warmups, passed output checks. The harness also verifies observed isolation, no writes in lower and all 256 upper files with correct sizes. Identical binaries, a mismatched build manifest, missing samples or interruption cannot produce a successful A/B summary.
A separate profiled batch does not enter the timing table. The candidate VM's two nonempty Core instances still record 126,034 / 168,027 parent metadata calls and 57,547 / 53,161 mount identity attempts at their last checkpoints. Dispatch checkpoints show 20,545 inline / 424 pool and 24,398 inline / 100 pool, with two workers each. The complete candidate host Core profile records 341 journal fsync calls totaling about 110 ms. Repeated Core physical path checks, first-observation/write journal costs and inline dispatch of small requests warrant separate experiments. Neither more workers nor virtiofsd can be assumed to remove these costs. VM checkpoints lack final records and are partial; nested inclusive spans must not be added, and admission time is not queue waiting time.
Validation passed: five guest tests, 292 full VM-package tests (two skipped), 24 executor tests excluding control and 24 benchmark tests, plus guest Clippy and benchmark Ruff. The wider executor subset in the worktree at measurement time had nine VM-control test failures, retained separately in the validation archive. This change does not modify control implementation or count those checks as passed.
Build both GNU/Linux binaries from the same source, applying only the proposed
change between builds. Use a fresh output directory and start with
--samples 1 --warmups 0 for preflight.
python3 benchmark/pvisor/filesystem_ab.py \
  --assets target/reference-env-final-20261004 \
  --baseline /absolute/path/to/pvisor-before \
  --candidate /absolute/path/to/pvisor-after \
  --firmware /absolute/path/to/libkrunfw-directory \
  --output target/filesystem-ab-new \
  --cpu-affinity 0,1 --samples 30 --warmups 3
Local raw record docs/src/assets/benchmarks/.data/filesystem-ab-20261005/samples.csv ·
Local raw record docs/src/assets/benchmarks/.data/filesystem-ab-20261005/summary.tsv ·
Local raw record docs/src/assets/benchmarks/.data/filesystem-ab-20261005/profiles.tsv ·
Local raw record docs/src/assets/benchmarks/.data/filesystem-ab-20261005/evidence.tar.gz
Retained historical-to-P0 comparison
This compares the 2026-10-04 complete-tool-environment N=30 batch with the latest candidate N=30 batch: internal tool P50 in ms. Both retain the tool fixture, but artifacts, host load and run protocols differ. Percentages describe differences across batches and cannot establish the controlled causal benefit of all optimizations. Use the same-batch A/B for the latest change's incremental benefit.
| Workload | Historical→latest staged | Across-batch change | Historical→latest VM | Across-batch change |
|---|---|---|---|---|
| metadata | 180.13 → 78.25 | -56.6% | 310.54 → 195.24 | -37.1% |
| read | 48.77 → 67.82 | +39.1% | 89.27 → 117.90 | +32.1% |
| write | 189.28 → 198.92 | +5.1% | 144.66 → 257.16 | +77.8% |
| git | 177.81 → 170.46 | -4.1% | 456.21 → 494.86 | +8.5% |
| rg | 144.61 → 90.58 | -37.4% | 545.82 → 464.97 | -14.8% |
| cargo | 112.80 → 110.11 | -2.4% | 549.57 → 512.74 | -6.7% |
| npm | 222.97 → 217.47 | -2.5% | 1727.04 → 1503.67 | -12.9% |
Existing measurements show lower traversal and search times; reads and writes did not improve alongside them. Docker, complete repair tasks and real Agent CLI loops were not rerun here. Historical data below retains its original dates and artifacts; filesystem percentages cannot predict their latest performance.
Local raw record docs/src/assets/benchmarks/.data/reference-env-20261004/summary.tsv ·
Local raw record docs/src/assets/benchmarks/.data/filesystem-ab-20261005/summary.tsv
Linux: 2026-10-05, OverlayCore resolution optimization
This release-mode experiment measures only the virtio-fs OverlayFs adapter,
without a VM, host FUSE mount or preimage journal. Fixtures live on /tmp
tmpfs: 32 directories with 64 files of 18 B each; deep paths have eight parent
components. Each trial has fresh inode tables and warm host caches. Fixture and
adapter construction are excluded from timing.
Preserved baseline and candidate test binaries were run through nextest binaries metadata in three alternating batches: old→new, new→old, old→new. Each case and batch has two warmups, eight unprofiled samples and one diagnostic sample. P50 uses only the 24 unprofiled samples per version. CPU affinity was not pinned; binary digests and individual batch medians are retained in the raw summary.
| Adapter operation, 2,048 files | Before P50 ms | After P50 ms | Elapsed reduction |
|---|---|---|---|
| lookup + getattr | 35.15 | 26.35 | 25.0% |
| lookup + open + getattr + release | 37.61 | 28.07 | 25.4% |
| Deep lookup + open + getattr + release | 170.51 | 96.85 | 43.2% |
| opendir + readdirplus + releasedir | 29.00 | 20.24 | 30.2% |
The shared OverlayCore now skips whiteout/opaque probes when this candidate's physical upper parent was just found missing or non-directory. Attributes and absence are not cached across requests; later components and final physical ancestors are still checked afresh. Deep-path diagnostic counts fell from 38,016 to 4,352 for each marker probe. Markers behind upper ancestor symlinks cannot hide lower entries. New tests also cover upper directories and whiteouts appearing within a walk and upper content changes between requests.
All 106 Core/host-adapter tests and 57 virtio-fs/descriptor/filesystem-snapshot
tests passed, as did Clippy for all targets of the three relevant packages. The initial
sandbox hid /dev/kvm and /dev/fuse, so that full VM-package attempt failed
at KVM initialization. This microbenchmark did not measure actual VM/FUSE jobs,
journaling, payload I/O or macOS. Subsequent host validation and end-to-end runs
appear in the P0 baseline above. Unrelated VM refactors
also occurred between builds; this adapter case does not execute UART/VMM/CPU
initialization. Binary digests identify the measured artifacts. These reductions
do not replace new measurements of the historical tool workloads below.
Reproduce one version's adapter measurement:
cargo nextest run --locked --release -p pvisor-vm \
  --run-ignored only --no-capture -E 'test(small_file_adapter_benchmark)'
Local raw record docs/src/assets/benchmarks/.data/overlay-resolution-20261005/samples.tsv · Local raw record docs/src/assets/benchmarks/.data/overlay-resolution-20261005/summary.tsv
Linux: 2026-10-04
Tool execution inside complete Ubuntu
The table excludes environment boot, measuring operations and grading. This new batch uses N=10 with 3 warmups, the same fixture and two-core budget, and 16 GiB VMs. pVisor uses host directories and staged virtio-fs; Ubuntu uses its vendor generic kernel, distribution tools and private ext4. The old Docker N=30 matrix remains separate without pooling percentiles.
| Workload | Native P50/P95 ms | pVisor staged P50/P95 ms | pVisor VM P50/P95 ms | Ubuntu P50/P95 ms |
|---|---|---|---|---|
| metadata | 4.85 / 5.11 | 177.80 / 195.52 | 291.82 / 359.75 | 18.64 / 19.90 |
| read | 33.29 / 48.97 | 48.12 / 61.21 | 88.83 / 127.21 | 115.51 / 117.69 |
| write | 3.75 / 4.43 | 186.95 / 208.86 | 134.37 / 154.03 | 36.07 / 36.35 |
| git | 14.66 / 17.07 | 172.18 / 194.52 | 613.69 / 807.73 | 136.50 / 140.81 |
| rg | 7.58 / 10.90 | 140.52 / 145.52 | 521.65 / 554.49 | 20.40 / 22.89 |
| cargo | 52.79 / 57.17 | 104.21 / 131.18 | 563.24 / 658.37 | 969.09 / 977.41 |
| npm | 218.82 / 245.85 | 256.29 / 292.67 | 2260.17 / 2408.63 | 1079.89 / 1110.93 |
These values locate waiting in traversal, search, compilation and installation. A single read does not establish that block devices always outperform FUSE: kernels, tool versions, storage and staging semantics differ together. For longer tasks, combine worker time with the complete loop rather than startup alone.
Local raw record docs/src/assets/benchmarks/.data/full-ubuntu-20261004/samples.csv · Local raw record docs/src/assets/benchmarks/.data/full-ubuntu-20261004/summary.tsv · Method and reproduction
Docker baseline in the complete tool environment
This adds a same-host Docker Engine measurement rather than relabeling Podman. Same two-core budget and inputs, 30 samples and 3 warmups per case; fixtures match the first edition, with seven operations executed sequentially in each fresh environment. Timings cover operations and validation, excluding environment startup. See the complete environment for the repair workflow. The two batches remain separate; percentiles are not pooled.
| Workload | Native P50/P95 ms | Docker P50/P95 ms | pVisor staged P50/P95 ms | pVisor VM P50/P95 ms |
|---|---|---|---|---|
| metadata | 5.04 / 6.78 | 5.06 / 7.50 | 180.13 / 202.88 | 310.54 / 351.59 |
| read | 33.07 / 41.44 | 33.24 / 45.06 | 48.77 / 61.60 | 89.27 / 99.34 |
| write | 3.96 / 5.09 | 3.95 / 5.65 | 189.28 / 204.67 | 144.66 / 164.67 |
| git | 15.75 / 20.50 | 16.07 / 20.07 | 177.81 / 195.97 | 456.21 / 786.35 |
| rg | 7.98 / 11.81 | 8.03 / 9.63 | 144.61 / 159.00 | 545.82 / 673.25 |
| cargo | 58.71 / 70.16 | 56.40 / 73.75 | 112.80 / 140.81 | 549.57 / 659.23 |
| npm | 183.46 / 197.57 | 231.45 / 288.60 | 222.97 / 256.33 | 1727.04 / 1978.79 |
This establishes a concrete position: Docker metadata/read/write stay close to native. Staged small-file traversal adds about 175 ms over Docker, and a 64 MiB read about 16 ms. An individual read costs tens of additional milliseconds; repeated small-file scans accumulate. VM offline npm installation takes about 1.73 seconds, against Docker's 0.23 seconds, a clear remaining gap. The roughly 86 ms VM startup figure cannot stand in for this tool budget.
Tasks verify file counts/sizes, SHA256, clean Git state, search matches, compiled output, and installed package counts. Docker uses a writable bind mount, pVisor a staged view, and Firecracker/QEMU private ext4. Different file paths are part of actual deployment cost; this is not a causal experiment changing only the VMM over an identical filesystem. The summary also contains each operation's distribution for other runtimes.
Configuration and reproduction · Local raw record docs/src/assets/benchmarks/.data/reference-env-20261004/samples.csv · Local raw record docs/src/assets/benchmarks/.data/reference-env-20261004/summary.tsv · Local raw record docs/src/assets/benchmarks/.data/reference-env-20261004/evidence.tar.gz · Local raw record docs/src/assets/benchmarks/.data/reference-env-20261004/compatibility.tsv
First-edition Linux matrix: separate batch
| Workload | Backend | N | Worker P50 ms | vs native | Wall P50 / P95 / P99 ms |
|---|---|---|---|---|---|
| metadata | native | 30 | 4.84 | +0.0% | 23.44 / 29.17 / 30.71 |
| metadata | host | 30 | 4.94 | +2.0% | 34.02 / 44.90 / 58.18 |
| metadata | staged | 30 | 149.60 | +2988.5% | 225.03 / 295.08 / 314.55 |
| metadata | safe | 30 | 171.26 | +3435.6% | 288.73 / 346.47 / 363.59 |
| metadata | vm | 30 | 263.08 | +5331.3% | 636.44 / 828.38 / 892.94 |
| metadata | podman | 30 | 4.95 | +2.1% | 138.99 / 158.58 / 159.34 |
| metadata | container | 30 | 4.83 | -0.3% | 320.21 / 419.26 / 479.51 |
| read | native | 30 | 32.66 | +0.0% | 52.81 / 125.98 / 143.36 |
| read | host | 30 | 31.80 | -2.6% | 64.65 / 213.37 / 232.88 |
| read | staged | 30 | 40.76 | +24.8% | 95.24 / 338.92 / 378.04 |
| read | safe | 30 | 41.38 | +26.7% | 153.98 / 386.69 / 390.96 |
| read | vm | 30 | 100.58 | +208.0% | 476.56 / 1379.77 / 1436.40 |
| read | podman | 30 | 32.68 | +0.1% | 170.64 / 408.95 / 452.05 |
| read | container | 30 | 33.57 | +2.8% | 405.55 / 945.63 / 1092.93 |
| write | native | 30 | 3.81 | +0.0% | 22.95 / 26.54 / 55.29 |
| write | host | 30 | 3.81 | -0.1% | 34.16 / 46.23 / 93.69 |
| write | staged | 30 | 192.46 | +4945.6% | 252.61 / 444.20 / 812.30 |
| write | safe | 30 | 199.56 | +5131.6% | 312.83 / 549.31 / 762.48 |
| write | vm | 30 | 114.68 | +2906.4% | 476.94 / 694.88 / 1003.73 |
| write | podman | 30 | 3.76 | -1.4% | 139.68 / 151.53 / 340.87 |
| write | container | 30 | 3.82 | +0.1% | 356.89 / 406.97 / 627.19 |
| git | native | 30 | 14.72 | +0.0% | 36.14 / 79.21 / 165.50 |
| git | host | 30 | 14.51 | -1.4% | 54.34 / 65.11 / 92.63 |
| git | staged | 30 | 203.33 | +1281.7% | 333.16 / 458.84 / 1316.66 |
| git | safe | 30 | 225.99 | +1435.7% | 394.38 / 491.36 / 960.78 |
| git | vm | 30 | 535.06 | +3536.0% | 929.22 / 1558.97 / 2447.31 |
| git | podman | 30 | 15.55 | +5.7% | 158.87 / 209.35 / 215.16 |
| git | container | 30 | 15.78 | +7.2% | 375.18 / 434.76 / 490.77 |
| rg | native | 30 | 6.72 | +0.0% | 26.54 / 28.70 / 29.90 |
| rg | host | 30 | 6.64 | -1.2% | 44.01 / 44.79 / 45.02 |
| rg | staged | 30 | 167.90 | +2399.9% | 288.07 / 312.76 / 320.23 |
| rg | safe | 30 | 190.82 | +2741.2% | 349.80 / 380.69 / 389.61 |
| rg | vm | 30 | 340.98 | +4976.9% | 717.00 / 769.33 / 780.18 |
| rg | podman | 30 | 5.90 | -12.2% | 141.36 / 154.73 / 160.82 |
| rg | container | 30 | 6.39 | -4.8% | 355.33 / 390.96 / 395.69 |
| cargo | native | 30 | 49.09 | +0.0% | 67.21 / 84.93 / 86.36 |
| cargo | host | 30 | 47.07 | -4.1% | 83.86 / 94.88 / 95.49 |
| cargo | staged | 30 | 90.31 | +84.0% | 146.28 / 167.31 / 168.42 |
| cargo | safe | 30 | 96.00 | +95.6% | 188.83 / 209.83 / 224.90 |
| cargo | vm | 30 | 541.56 | +1003.1% | 897.61 / 959.14 / 959.43 |
| npm | native | 30 | 157.56 | +0.0% | 175.60 / 205.84 / 434.16 |
| npm | host | 30 | 156.38 | -0.7% | 184.73 / 204.95 / 552.20 |
| npm | staged | 30 | 187.87 | +19.2% | 235.76 / 256.13 / 608.48 |
| npm | safe | 30 | 232.30 | +47.4% | 318.58 / 432.25 / 708.12 |
| npm | podman | 30 | 208.41 | +32.3% | 339.64 / 474.65 / 857.37 |
| npm | container | 30 | 195.29 | +23.9% | 515.88 / 552.03 / 891.62 |
Analysis
Staged sequential reads cost about +25% and offline npm +19%. Metadata is about 31× native and small-file writes about 50×, adding roughly 150–190 ms to native operations lasting only milliseconds. Host worker time is near native; full jobs include CLI/recording overhead. Safe adds namespace/policy/proxy setup. Most measured VM jobs take roughly 0.5–1 second.
This historical batch uses Podman as the OCI control; Docker daemon access was unavailable then. A later batch adds rootless Docker Engine bind-mount measurements, shown in the complete-environment comparison above. Docker overlay2 and Docker Desktop remain unmeasured. pVisor OCI prepares a private rootfs per Job; wall time includes this while worker time isolates tool execution.
Compatibility follow-up
Container cargo initially lacked linker startup files, a fixture-image error. After adding glibc/GCC files, Fedora linker scripts still required /lib64/libmvec.so.1. The final cargo-ready batch supplies that path and passes every sample, listed separately; both setup failures remain in reports. VM Node failed to reserve V8 address space with the 1 GiB shape; follow-up uses a 16 GiB address-space configuration, kept separate from the main 1 GiB batch.
| Workload | Backend | N | Worker P50 / P95 / P99 ms | Wall P50 / P95 / P99 ms |
|---|---|---|---|---|
| cargo | native | 30 | 52.90 / 65.79 / 76.17 | 71.96 / 89.41 / 103.04 |
| cargo | host | 30 | 52.60 / 70.49 / 75.30 | 84.38 / 111.79 / 124.56 |
| cargo | staged | 30 | 116.07 / 139.93 / 233.90 | 166.65 / 210.57 / 397.55 |
| cargo | safe | 30 | 119.77 / 138.77 / 228.23 | 209.92 / 242.16 / 342.22 |
| cargo | vm | 30 | 567.42 / 1365.43 / 2047.17 | 1271.15 / 2683.43 / 3889.27 |
| npm | native | 30 | 162.86 / 433.44 / 488.04 | 181.47 / 472.60 / 531.93 |
| npm | host | 30 | 163.56 / 430.53 / 475.14 | 205.34 / 522.04 / 595.23 |
| npm | staged | 30 | 213.17 / 437.03 / 612.15 | 266.48 / 544.87 / 780.57 |
| npm | safe | 30 | 256.70 / 717.56 / 777.67 | 339.63 / 983.34 / 1085.49 |
| npm | vm | 30 | 985.29 / 3238.12 / 4617.06 | 1661.91 / 5172.18 / 5755.11 |
| npm | podman | 30 | 217.06 / 547.44 / 833.45 | 365.17 / 883.42 / 1239.59 |
| npm | container | 30 | 202.48 / 587.65 / 601.74 | 550.89 / 1368.06 / 1469.75 |
| Cargo corrected /lib64 image | N | Worker P50/P95/P99 ms | Wall P50/P95/P99 ms |
|---|---|---|---|
| native | 30 | 51.52 / 59.70 / 62.44 | 70.85 / 80.25 / 82.02 |
| podman | 30 | 49.29 / 54.35 / 55.75 | 181.18 / 187.71 / 189.70 |
| container | 30 | 51.99 / 57.94 / 59.96 | 405.08 / 425.10 / 425.46 |
Limits and next measurements
Main VM jobs use host rootfs /, 2 vCPU/1 GiB and a host read view. This is a tool compatibility profile; host-secret protection is tested separately in isolation. These small offline warm-cache tasks do not establish full-repository build performance or cold-disk throughput. macFUSE/FSKit, actual registry installs and Docker/overlay2 await comparable measurements.
Reproduction and evidence
Run from the repository root with a new output directory. This dynamic firmware entry requires the GNU/Linux CLI; static musl builds use a different firmware entry. This host has Linux, KVM/FUSE/user namespaces, Python 3.14, Rust/GCC, Git/rg, Node 24/npm and Podman/crun. The agent suite also needs the Claude/Codex CLIs.
python3 benchmark/pvisor/product_v1.py \
  --binary /absolute/path/to/gnu-linux/pvisor \
  --firmware /absolute/path/to/libkrunfw-directory \
  --replay-binary /absolute/path/to/pvisor-replay \
  --output target/product-benchmark-new \
  --suites filesystem --samples 30 --warmups 3
Start with --samples 1 --warmups 0 to check prerequisites. Workloads and correctness assertions live in benchmark/pvisor/v1/. Reports pin binaries, firmware and harness source with hashes. Failed operations never enter performance distributions. Effective sample counts are stated per page; P95/P99 from small samples describe this batch rather than production tail probabilities.
Environment, artifacts and method · Local raw record docs/src/assets/benchmarks/.data/product-v1-20261004/manifest.tsv · Local raw record docs/src/assets/benchmarks/.data/product-v1-20261004/samples.csv · Local raw record docs/src/assets/benchmarks/.data/product-v1-20261004/evidence.tar.gz. Reports retain dirty source status; executable SHA256 identifies the measured artifact. The archive excludes large rootfs/binaries and reproducible workspace payloads, while retaining input hashes and each batch's harness.