Use the local Web UI
pchronicle serve provides a loopback-only, read-only workspace for browsing
Datasets, drilling into Runs, analyzing results, and inspecting Lance
storage. The screenshots and examples on this page were produced directly by:
./target/release/pchronicle serve tmp/test/ data/ --listen 127.0.0.1:9980
After the listener is ready, open http://127.0.0.1:9980/. This command mounts
two Datasets. Because neither has an explicit name, the UI derives test and
data from the last path component. Give mounts stable UI and SQL schema names
when they will be reused:
./target/release/pchronicle serve \
  test=tmp/test data=data \
  --listen 127.0.0.1:9980
Add --open to open the system browser after the listener is ready. The server
accepts loopback addresses only. Browsing, querying, and refreshing through the
UI or API do not modify a mounted Dataset.
Workspace map
The left rail separates the common tasks into five surfaces:
| Surface | Use it to |
|---|---|
| Datasets | See mounted Datasets and Run counts, then enter Runs. |
| Runs | Filter by path, Dataset, status, or text and open one Run. |
| Analysis | Inspect available fields and analyze with a question or read-only SQL. |
| Storage | Inspect Lance tables, data groups, column distributions, and storage size. |
| Assistant | Ask about the current Run after configuring a compatible model. |
Local at the bottom of the rail indicates that the UI is connected to the local pChronicle server.
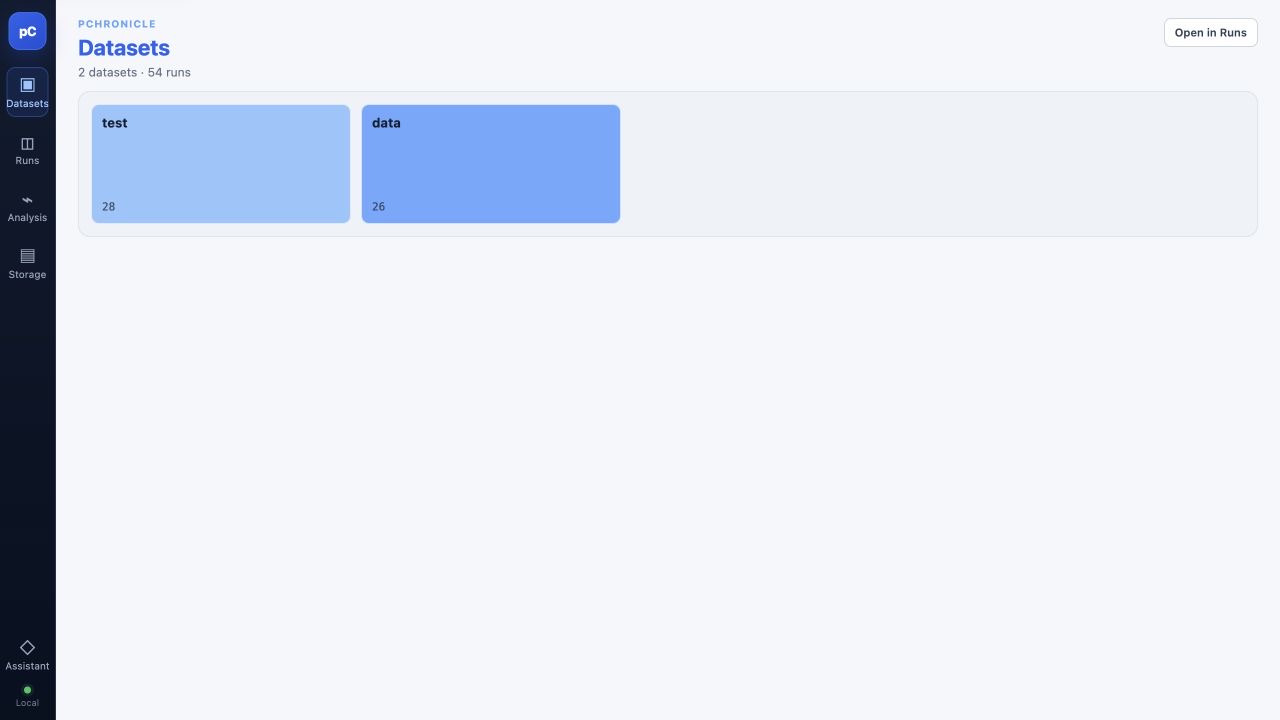
Datasets is the landing page. Each card shows a Dataset name and Run count. Select a card to open that Dataset's data overview, then use Open in Runs to open the current scope. The button with the same name on the landing page opens all Runs.
Browse and filter Runs
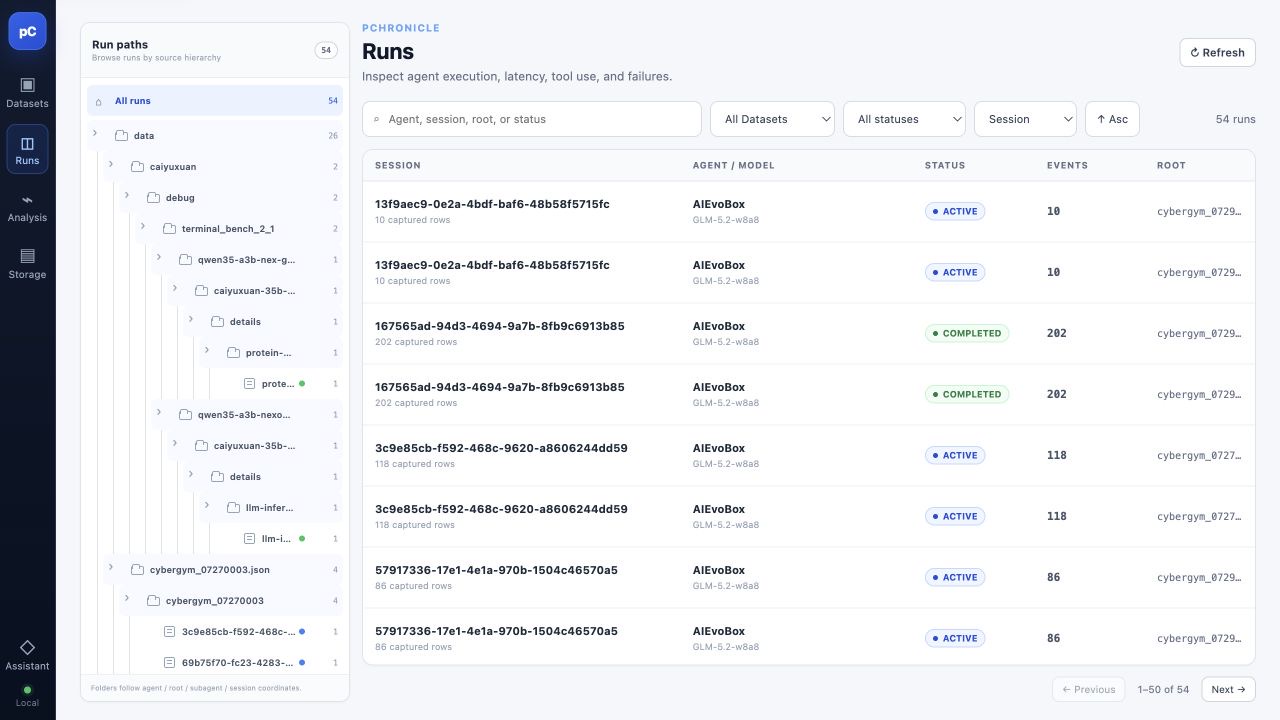
The Runs page combines a path tree and a result table:
- Select a Dataset, folder level, or Session in Run paths. The number at the right of a node is the number of Runs below it.
- Search for an Agent, Session, root, or status. Use the adjacent controls to constrain Dataset and status, then choose the sort field and direction.
- Read Session, Agent / Model, status, event count, and root in the table. Select a row to open its detail page.
- Use Refresh after the underlying data changes. Use Previous / Next when the result spans several pages.
The path tree is useful for narrowing the hierarchy before applying text and
status filters. For example, select data and then the status you need, or
paste a known Session ID directly into the search box.
Read one Run
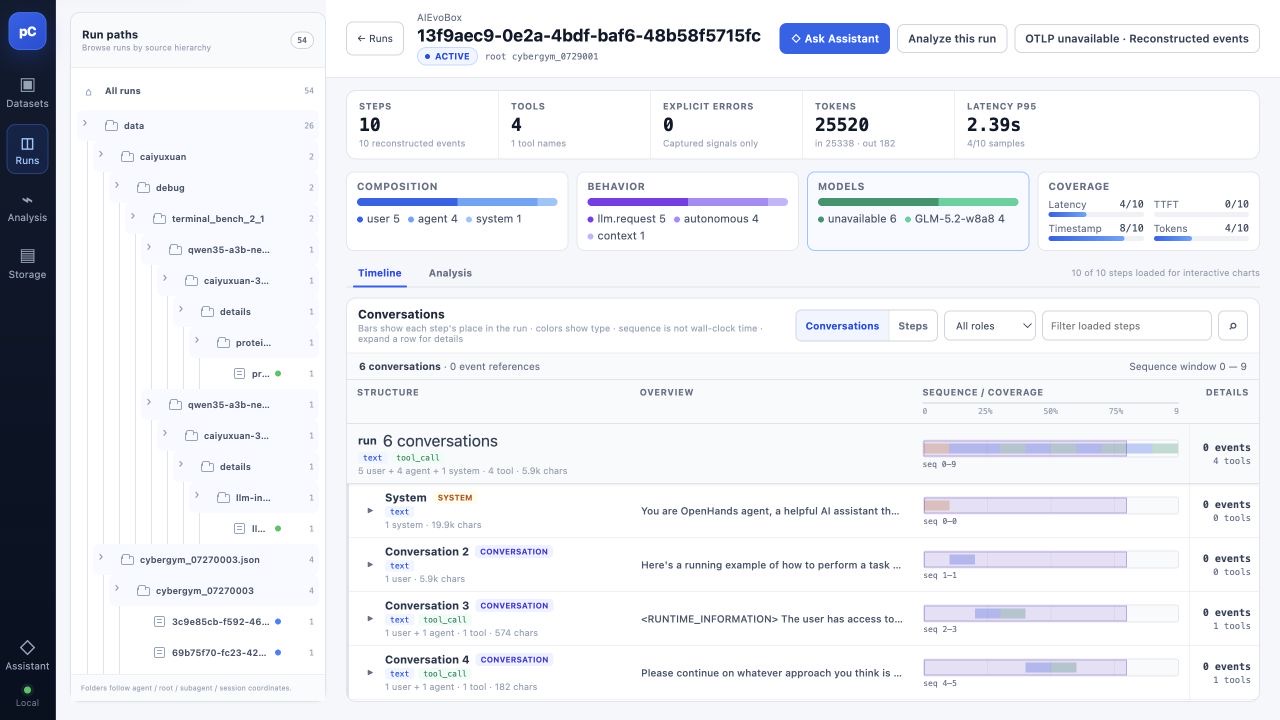
The Run page has three layers:
- The header identifies the Agent, Session, status, and root. Ask Assistant and Analyze this run carry the current Run into another workspace.
- Summary cards show Steps, Tools, Explicit errors, Tokens, and Latency P95. Composition, Behavior, Models, and Coverage make the Run makeup and available observability data visible at a glance.
- Timeline exposes recorded details. Switch between Conversations / Steps, filter by role or text, and expand a row to inspect complete text, tool calls, and event references. Analysis opens the Run-level analysis view.
Timeline bars show records at their positions in the Session sequence; they are not a wall-clock latency chart. Captured text, tool calls, and metrics remain usable.
Analyze Datasets
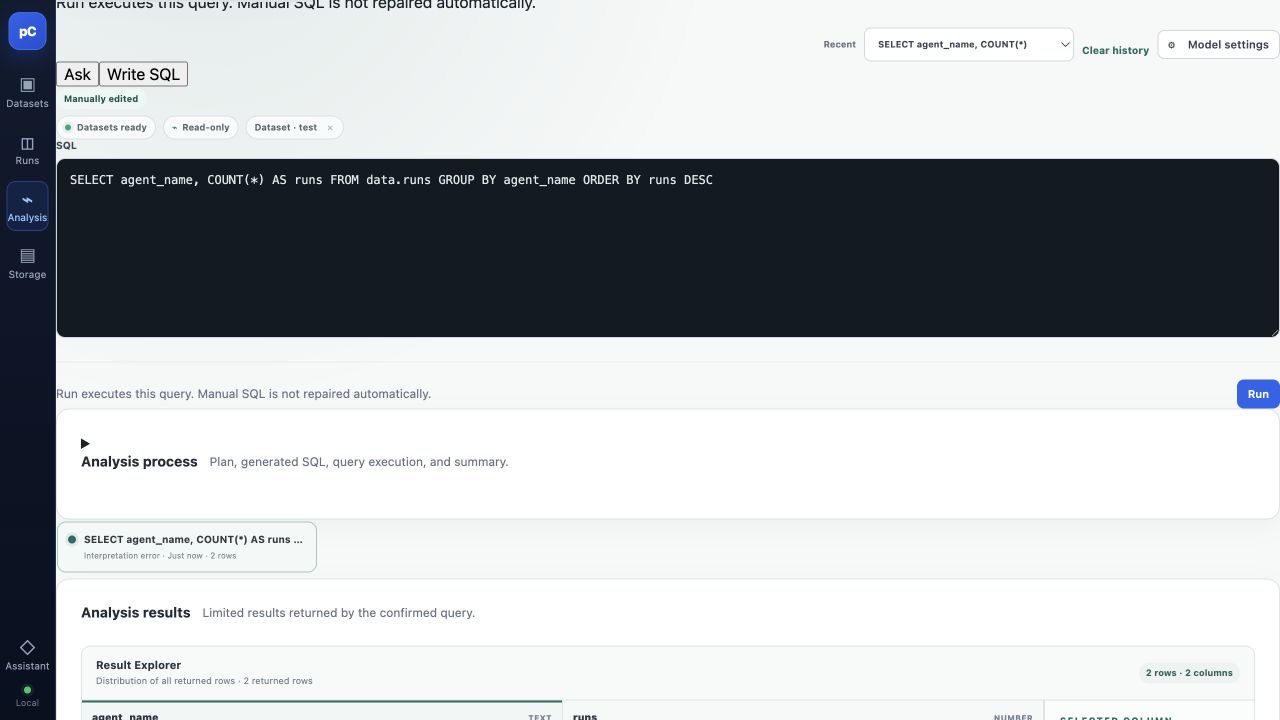
The left panel lists the queryable tables and fields for each Dataset. A mount
name is also its SQL schema, so this example exposes test.runs, data.runs,
and related tables.
Choose one input mode:
- Ask accepts a natural-language question. Configure an OpenAI-compatible model in Model settings first. pChronicle creates an analysis plan and then executes a size-limited, read-only query.
- Write SQL executes SQL directly. Handwritten SQL is not repaired by the model, so confirm exact column names in the schema panel.
For example, count Runs by Agent in data:
SELECT agent_name, COUNT(*) AS runs
FROM data.runs
GROUP BY agent_name
ORDER BY runs DESC
Result Explorer shows rows, column types, missing rates, and the distribution of the selected column. Results are limited by the row and size limit displayed by the UI. If optional model interpretation fails, returned SQL rows and column profiles remain available; fix the model settings or retry the summary without discarding the results.
Inspect Lance storage
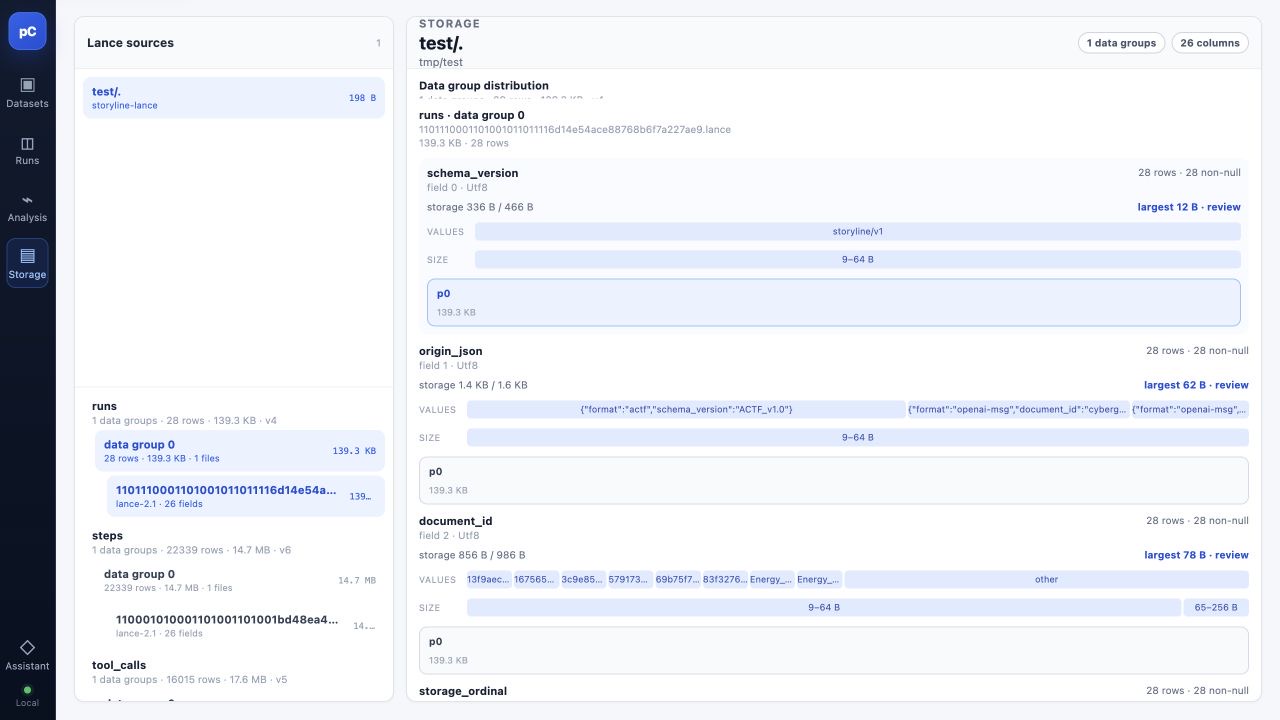
Storage is an advanced diagnostic surface, not a prerequisite for browsing Runs. The left panel shows Lance tables and their data groups by Dataset. The right panel profiles row counts, non-null counts, encoded storage size, value distribution, and size distribution for each column. Use it to determine:
- which table or column consumes the most storage;
- whether a column is mostly missing or has a suspicious distribution;
- whether a Dataset has a stored projection ready for analysis.
This page inspects the existing layout. It does not expose compaction, rewrite, or maintenance operations.
Configure Assistant
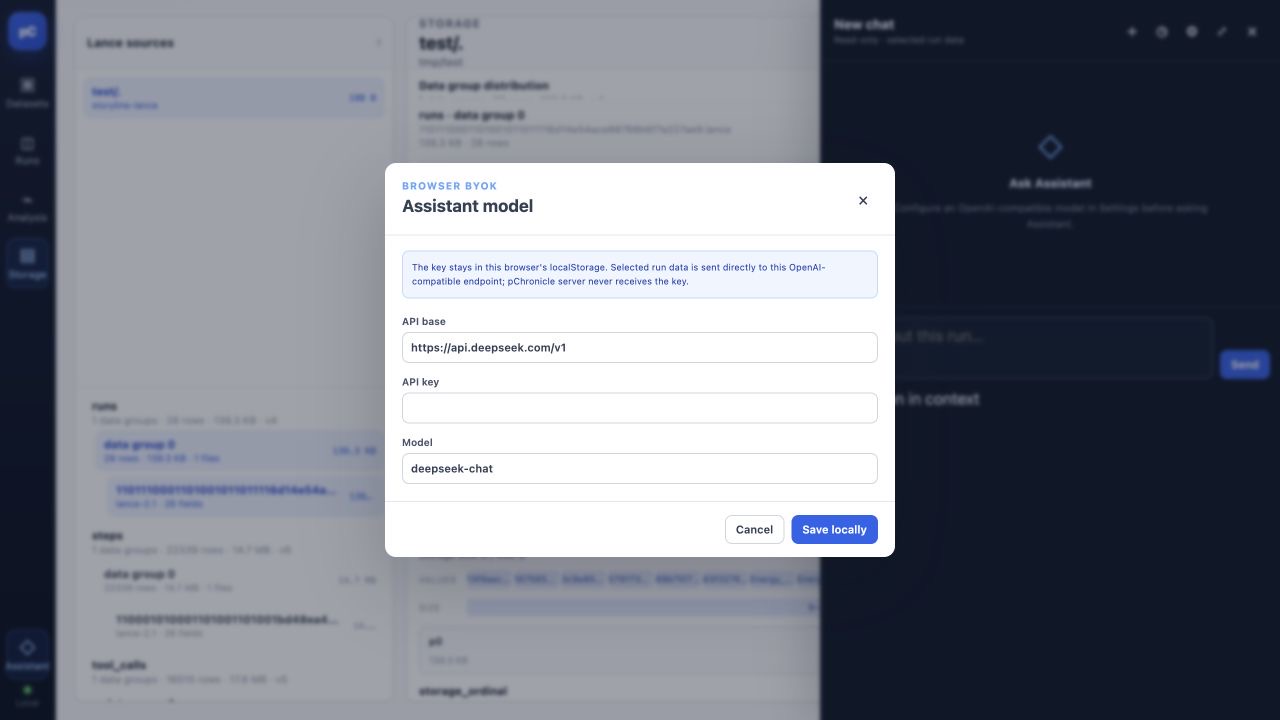
- Open Assistant from the left rail, then select the settings gear.
- Enter the OpenAI-compatible API base, API key, and Model.
- Select Save locally, return to a Run, and use Ask Assistant.
This is browser BYOK. The key stays in this browser's localStorage; selected
Run data is sent directly from the browser to the configured model endpoint,
and the pChronicle server never receives the key. Do not save a key in an
untrusted or shared browser profile. Clearing this site's browser data also
clears the setting. Assistant is labeled Read-only · selected run data and
does not rewrite the Dataset.
When pchronicle serve --catalog-config is used, every library in the ACL file
is already mounted for local browsing. Open Keys on the left rail if you
need Directory user access/secret headers for authenticated Directory flows.
Those values are stored in localStorage and sent to this pchronicle server as
x-pchronicle-access-key and x-pchronicle-secret-key on data requests. They
authorize which Directory paths this browser may open; they are not the
object-store backend keys.
Troubleshooting
127.0.0.1:9980 is already in use
Choose another loopback port:
./target/release/pchronicle serve tmp/test/ data/ --listen 127.0.0.1:9981
Dataset names are not what you expected
Multiple bare paths derive names from their last path component. Use
NAME=DATASET, such as evals=data/, to make the UI name and SQL schema stable.
Ask or Assistant cannot send
Open Model settings or the Assistant settings gear and configure a working OpenAI-compatible endpoint, key, and model. Use Write SQL in Analysis when no model is needed.
SQL reports a missing field
Select the target table in Analysis and confirm the field name in the left panel. The mount name is the schema. The UI requires you to fix and rerun handwritten SQL; it does not ask a model to rewrite it.
The Dataset changed but the UI still shows old data
Return to Runs and select Refresh. pChronicle replaces the readable view only after the replacement is ready; a failed refresh leaves the previous view available.
For all server options, see Serve Datasets locally. For exact CLI
arguments, see the pchronicle reference.